|
Download Data (XLS File) |
|
||||||||
|
||||||||
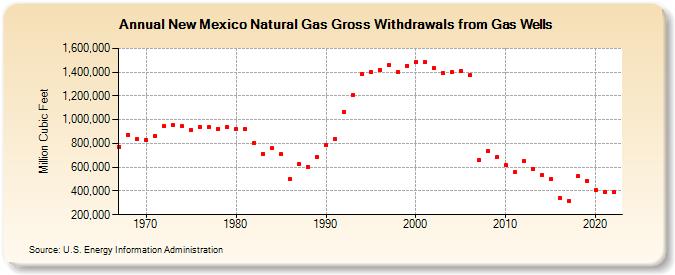
| New Mexico Natural Gas Gross Withdrawals from Gas Wells (Million Cubic Feet) | ||||||||
| Decade | Year-0 | Year-1 | Year-2 | Year-3 | Year-4 | Year-5 | Year-6 | Year-7 | Year-8 | Year-9 |
|---|---|---|---|---|---|---|---|---|---|---|
| 1960's | 774,007 | 873,211 | 837,521 | |||||||
| 1970's | 832,771 | 861,520 | 944,463 | 954,632 | 944,515 | 915,370 | 939,491 | 935,731 | 924,495 | 935,523 |
| 1980's | 920,168 | 917,987 | 804,444 | 714,572 | 758,699 | 707,265 | 501,730 | 626,848 | 602,740 | 685,363 |
| 1990's | 783,963 | 840,767 | 1,067,477 | 1,208,771 | 1,381,756 | 1,398,631 | 1,418,116 | 1,460,104 | 1,404,467 | 1,453,917 |
| 2000's | 1,484,269 | 1,484,856 | 1,432,966 | 1,391,916 | 1,397,934 | 1,408,499 | 1,376,540 | 657,593 | 732,483 | 682,334 |
| 2010's | 616,134 | 556,024 | 653,057 | 588,127 | 532,600 | 499,504 | 342,339 | 316,914 | 523,228 | 486,650 |
| 2020's | 408,726 | 390,453 | 388,770 |
| - = No Data Reported; -- = Not Applicable; NA = Not Available; W = Withheld to avoid disclosure of individual company data. |
| Release Date: 3/29/2024 |
| Next Release Date: 4/30/2024 |