|
Download Data (XLS File) |
|
||||||||
|
||||||||
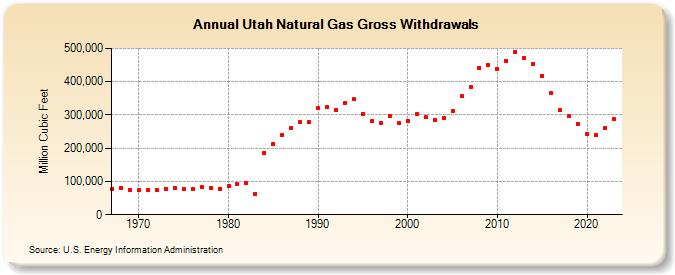
| Utah Natural Gas Gross Withdrawals (Million Cubic Feet) | ||||||||
| Decade | Year-0 | Year-1 | Year-2 | Year-3 | Year-4 | Year-5 | Year-6 | Year-7 | Year-8 | Year-9 |
|---|---|---|---|---|---|---|---|---|---|---|
| 1960's | 78,284 | 79,299 | 75,167 | |||||||
| 1970's | 73,386 | 74,260 | 75,664 | 78,511 | 79,973 | 77,607 | 78,646 | 82,599 | 80,227 | 78,674 |
| 1980's | 87,766 | 91,191 | 94,255 | 63,158 | 184,606 | 213,302 | 238,388 | 261,911 | 277,910 | 278,081 |
| 1990's | 319,632 | 323,660 | 314,275 | 336,183 | 347,019 | 303,233 | 281,208 | 274,920 | 297,265 | 276,967 |
| 2000's | 281,117 | 301,422 | 293,063 | 284,359 | 290,586 | 311,994 | 356,321 | 385,361 | 441,598 | 449,511 |
| 2010's | 436,885 | 461,507 | 490,393 | 470,863 | 454,545 | 417,020 | 365,268 | 315,211 | 295,826 | 272,752 |
| 2020's | 242,560 | 239,951 | 261,196 | 287,748 |
| - = No Data Reported; -- = Not Applicable; NA = Not Available; W = Withheld to avoid disclosure of individual company data. |
| Release Date: 4/30/2024 |
| Next Release Date: 5/31/2024 |