|
Download Data (XLS File) |
|
||||||||
|
||||||||
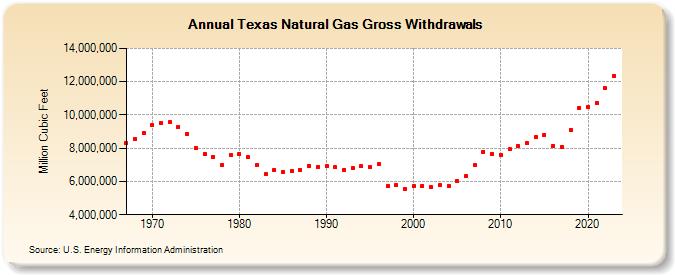
| Texas Natural Gas Gross Withdrawals (Million Cubic Feet) | ||||||||
| Decade | Year-0 | Year-1 | Year-2 | Year-3 | Year-4 | Year-5 | Year-6 | Year-7 | Year-8 | Year-9 |
|---|---|---|---|---|---|---|---|---|---|---|
| 1960's | 8,291,509 | 8,566,088 | 8,914,794 | |||||||
| 1970's | 9,398,526 | 9,518,644 | 9,550,469 | 9,289,945 | 8,859,044 | 7,988,773 | 7,665,932 | 7,495,913 | 6,987,843 | 7,593,544 |
| 1980's | 7,656,061 | 7,451,592 | 6,975,620 | 6,429,019 | 6,712,325 | 6,576,919 | 6,656,337 | 6,687,689 | 6,918,622 | 6,881,041 |
| 1990's | 6,907,056 | 6,845,543 | 6,708,012 | 6,816,927 | 6,911,705 | 6,872,656 | 7,028,201 | 5,729,602 | 5,798,893 | 5,574,951 |
| 2000's | 5,722,921 | 5,752,446 | 5,661,005 | 5,791,324 | 5,733,918 | 6,006,837 | 6,326,433 | 6,960,858 | 7,800,655 | 7,653,647 |
| 2010's | 7,593,697 | 7,934,689 | 8,143,510 | 8,299,472 | 8,659,188 | 8,799,465 | 8,156,296 | 8,079,974 | 9,109,174 | 10,432,505 |
| 2020's | 10,489,727 | 10,743,106 | 11,602,524 | 12,367,883 |
| - = No Data Reported; -- = Not Applicable; NA = Not Available; W = Withheld to avoid disclosure of individual company data. |
| Release Date: 3/29/2024 |
| Next Release Date: 4/30/2024 |