|
Download Data (XLS File) |
|
||||||||
|
||||||||
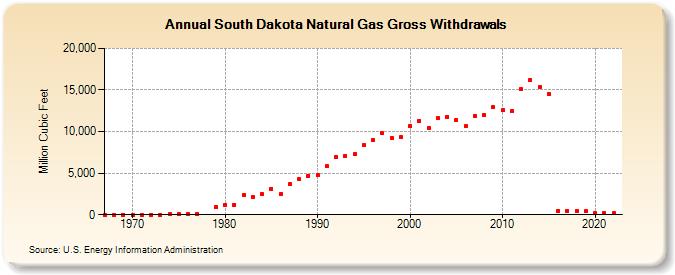
| South Dakota Natural Gas Gross Withdrawals (Million Cubic Feet) | ||||||||
| Decade | Year-0 | Year-1 | Year-2 | Year-3 | Year-4 | Year-5 | Year-6 | Year-7 | Year-8 | Year-9 |
|---|---|---|---|---|---|---|---|---|---|---|
| 1960's | 0 | 0 | 0 | |||||||
| 1970's | 0 | 9 | 8 | 10 | 48 | 39 | 52 | 69 | 919 | |
| 1980's | 1,198 | 1,207 | 2,385 | 2,130 | 2,483 | 3,146 | 2,463 | 3,662 | 4,283 | 4,704 |
| 1990's | 4,782 | 5,804 | 6,963 | 7,057 | 7,264 | 8,374 | 8,965 | 9,795 | 9,252 | 9,340 |
| 2000's | 10,680 | 11,313 | 10,424 | 11,605 | 11,768 | 11,349 | 10,616 | 11,880 | 12,007 | 12,927 |
| 2010's | 12,540 | 12,449 | 15,085 | 16,205 | 15,305 | 14,510 | 455 | 476 | 447 | 414 |
| 2020's | 160 | 161 | 165 |
| - = No Data Reported; -- = Not Applicable; NA = Not Available; W = Withheld to avoid disclosure of individual company data. |
| Release Date: 3/29/2024 |
| Next Release Date: 4/30/2024 |