|
Download Data (XLS File) |
|
||||||||
|
||||||||
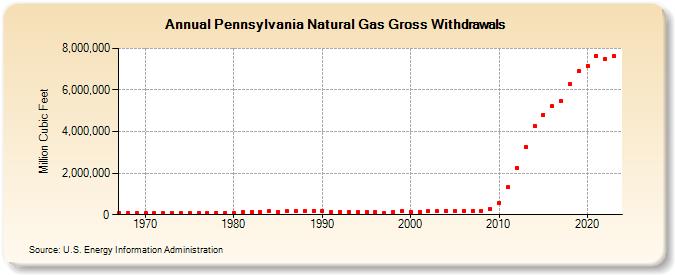
| Pennsylvania Natural Gas Gross Withdrawals (Million Cubic Feet) | ||||||||
| Decade | Year-0 | Year-1 | Year-2 | Year-3 | Year-4 | Year-5 | Year-6 | Year-7 | Year-8 | Year-9 |
|---|---|---|---|---|---|---|---|---|---|---|
| 1960's | 90,341 | 88,307 | 79,446 | |||||||
| 1970's | 77,114 | 76,451 | 73,958 | 78,514 | 82,735 | 84,772 | 89,485 | 91,792 | 97,763 | 96,313 |
| 1980's | 97,439 | 122,454 | 121,111 | 118,372 | 166,342 | 150,234 | 159,889 | 163,318 | 167,089 | 191,774 |
| 1990's | 177,609 | 152,500 | 138,675 | 132,130 | 120,506 | 111,000 | 135,000 | 80,000 | 130,317 | 174,701 |
| 2000's | 150,000 | 130,853 | 157,800 | 159,827 | 197,217 | 168,501 | 175,950 | 182,277 | 198,295 | 273,869 |
| 2010's | 572,902 | 1,310,592 | 2,256,696 | 3,259,042 | 4,257,693 | 4,812,983 | 5,210,209 | 5,453,638 | 6,264,832 | 6,896,792 |
| 2020's | 7,168,902 | 7,647,068 | 7,511,179 | 7,619,589 |
| - = No Data Reported; -- = Not Applicable; NA = Not Available; W = Withheld to avoid disclosure of individual company data. |
| Release Date: 3/29/2024 |
| Next Release Date: 4/30/2024 |