|
Download Data (XLS File) |
|
||||||||
|
||||||||
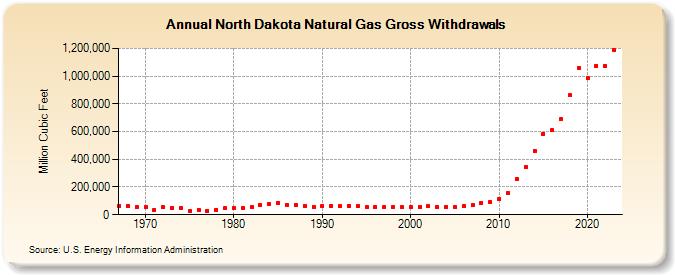
| North Dakota Natural Gas Gross Withdrawals (Million Cubic Feet) | ||||||||
| Decade | Year-0 | Year-1 | Year-2 | Year-3 | Year-4 | Year-5 | Year-6 | Year-7 | Year-8 | Year-9 |
|---|---|---|---|---|---|---|---|---|---|---|
| 1960's | 66,257 | 63,073 | 56,542 | |||||||
| 1970's | 54,751 | 36,550 | 53,258 | 50,236 | 49,066 | 26,941 | 34,207 | 30,289 | 37,287 | 45,400 |
| 1980's | 50,321 | 51,955 | 53,819 | 70,428 | 78,752 | 84,631 | 70,955 | 71,737 | 66,318 | 58,326 |
| 1990's | 63,590 | 62,657 | 59,979 | 64,951 | 63,232 | 56,674 | 55,716 | 56,292 | 57,614 | 55,633 |
| 2000's | 55,789 | 57,987 | 59,978 | 57,886 | 57,333 | 55,904 | 62,786 | 70,797 | 87,188 | 92,489 |
| 2010's | 113,867 | 157,025 | 258,568 | 345,787 | 463,216 | 584,632 | 608,849 | 688,600 | 860,817 | 1,061,091 |
| 2020's | 986,977 | 1,075,553 | 1,071,706 | 1,191,492 |
| - = No Data Reported; -- = Not Applicable; NA = Not Available; W = Withheld to avoid disclosure of individual company data. |
| Release Date: 3/29/2024 |
| Next Release Date: 4/30/2024 |