|
Download Data (XLS File) |
|
||||||||
|
||||||||
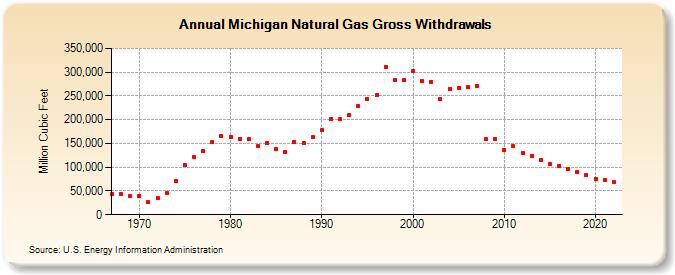
| Michigan Natural Gas Gross Withdrawals (Million Cubic Feet) | ||||||||
| Decade | Year-0 | Year-1 | Year-2 | Year-3 | Year-4 | Year-5 | Year-6 | Year-7 | Year-8 | Year-9 |
|---|---|---|---|---|---|---|---|---|---|---|
| 1960's | 43,092 | 43,930 | 38,690 | |||||||
| 1970's | 40,038 | 26,450 | 35,253 | 45,696 | 70,464 | 103,901 | 121,631 | 133,226 | 152,184 | 164,860 |
| 1980's | 164,110 | 158,293 | 158,771 | 144,574 | 150,201 | 137,519 | 132,951 | 153,307 | 151,809 | 162,826 |
| 1990's | 177,815 | 201,413 | 200,479 | 210,299 | 228,321 | 243,867 | 251,404 | 311,614 | 283,740 | 283,028 |
| 2000's | 302,220 | 280,700 | 280,140 | 242,651 | 265,345 | 266,776 | 268,673 | 270,571 | 158,794 | 159,400 |
| 2010's | 136,782 | 143,826 | 129,333 | 123,622 | 115,065 | 107,664 | 102,003 | 96,451 | 89,572 | 83,969 |
| 2020's | 75,935 | 74,057 | 69,542 |
| - = No Data Reported; -- = Not Applicable; NA = Not Available; W = Withheld to avoid disclosure of individual company data. |
| Release Date: 3/29/2024 |
| Next Release Date: 4/30/2024 |