|
Download Data (XLS File) |
|
||||||||
|
||||||||
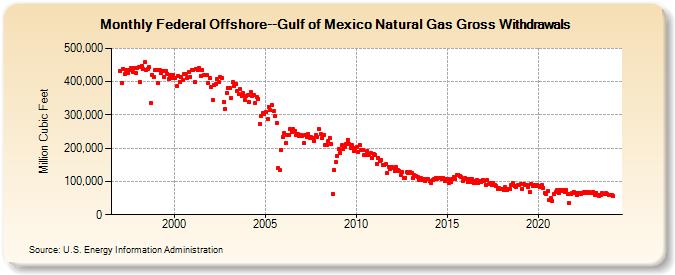
| Federal Offshore--Gulf of Mexico Natural Gas Gross Withdrawals (Million Cubic Feet) | ||||||||
| Year | Jan | Feb | Mar | Apr | May | Jun | Jul | Aug | Sep | Oct | Nov | Dec |
|---|---|---|---|---|---|---|---|---|---|---|---|---|
| 1997 | 432,713 | 396,681 | 438,926 | 423,131 | 435,592 | 426,888 | 434,325 | 439,712 | 428,689 | 440,668 | 425,849 | 441,756 |
| 1998 | 443,757 | 398,519 | 448,486 | 438,144 | 457,815 | 435,237 | 439,093 | 443,144 | 336,241 | 421,315 | 414,058 | 434,518 |
| 1999 | 436,171 | 395,293 | 435,012 | 424,724 | 432,489 | 414,495 | 431,981 | 424,513 | 408,237 | 421,312 | 409,660 | 419,049 |
| 2000 | 411,264 | 385,685 | 418,062 | 398,966 | 413,434 | 405,362 | 422,701 | 423,114 | 411,610 | 428,272 | 415,005 | 434,219 |
| 2001 | 434,184 | 398,663 | 439,076 | 435,345 | 441,501 | 417,857 | 434,635 | 419,998 | 418,958 | 419,260 | 396,367 | 410,171 |
| 2002 | 383,809 | 345,197 | 389,496 | 392,340 | 408,474 | 398,477 | 413,392 | 411,800 | 339,794 | 316,395 | 366,864 | 381,589 |
| 2003 | 381,172 | 350,913 | 398,140 | 388,074 | 393,109 | 370,801 | 363,173 | 377,014 | 356,722 | 365,170 | 346,264 | 356,796 |
| 2004 | 359,035 | 337,697 | 368,940 | 355,585 | 360,669 | 336,707 | 354,323 | 347,930 | 272,780 | 297,369 | 306,517 | 303,133 |
| 2005 | 310,146 | 287,094 | 323,892 | 313,344 | 329,586 | 310,887 | 295,265 | 277,113 | 139,762 | 134,985 | 195,597 | 233,147 |
| 2006 | 245,725 | 214,905 | 240,816 | 239,564 | 257,004 | 248,874 | 257,355 | 251,758 | 239,748 | 243,308 | 236,828 | 238,246 |
| 2007 | 236,459 | 215,086 | 239,968 | 233,583 | 243,577 | 230,158 | 232,203 | 229,259 | 222,287 | 239,307 | 233,331 | 257,979 |
| 2008 | 242,267 | 229,553 | 240,471 | 210,306 | 209,626 | 220,165 | 231,494 | 212,921 | 62,990 | 135,398 | 158,925 | 175,838 |
| 2009 | 196,895 | 185,793 | 208,497 | 196,512 | 204,774 | 212,642 | 225,441 | 212,595 | 201,837 | 208,583 | 191,303 | 199,232 |
| 2010 | 203,379 | 188,967 | 210,438 | 195,203 | 193,933 | 179,643 | 180,332 | 191,112 | 178,304 | 184,571 | 171,709 | 181,553 |
| 2011 | 180,251 | 153,482 | 169,831 | 162,198 | 164,039 | 150,882 | 148,861 | 151,602 | 124,788 | 143,082 | 138,426 | 143,471 |
| 2012 | 141,312 | 130,558 | 142,800 | 133,745 | 130,695 | 118,012 | 128,147 | 110,373 | 111,143 | 127,214 | 125,639 | 128,238 |
| 2013 | 124,362 | 109,780 | 118,101 | 115,853 | 114,477 | 104,271 | 110,013 | 104,060 | 108,728 | 102,124 | 108,102 | 106,827 |
| 2014 | 102,309 | 95,596 | 105,440 | 106,362 | 111,475 | 107,406 | 109,951 | 110,811 | 106,522 | 110,725 | 101,778 | 107,362 |
| 2015 | 107,681 | 95,373 | 96,915 | 108,387 | 112,773 | 106,744 | 118,085 | 120,511 | 117,390 | 112,082 | 102,391 | 109,310 |
| 2016 | 106,127 | 98,287 | 108,380 | 98,939 | 107,850 | 95,158 | 101,199 | 103,424 | 95,284 | 102,131 | 99,339 | 104,539 |
| 2017 | 102,820 | 90,122 | 103,082 | 92,264 | 96,552 | 88,369 | 95,249 | 90,215 | 85,937 | 78,298 | 79,292 | 76,016 |
| 2018 | 76,246 | 72,839 | 81,870 | 73,817 | 76,450 | 77,240 | 89,808 | 95,580 | 86,441 | 84,347 | 88,120 | 89,946 |
| 2019 | 91,606 | 78,046 | 93,532 | 88,575 | 89,453 | 83,554 | 68,554 | 92,674 | 85,622 | 88,263 | 85,170 | 88,988 |
| 2020 | 87,776 | 82,510 | 89,255 | 81,544 | 65,458 | 63,441 | 69,829 | 45,498 | 50,353 | 40,228 | 61,826 | 68,618 |
| 2021 | 72,898 | 65,242 | 75,181 | 70,698 | 73,022 | 68,393 | 72,847 | 62,280 | 35,341 | 60,776 | 66,508 | 68,916 |
| 2022 | 65,420 | 57,832 | 65,440 | 66,292 | 62,991 | 65,130 | 67,456 | 69,090 | 66,095 | 67,409 | 65,505 | 65,907 |
| 2023 | 68,910 | 60,583 | 66,064 | 59,529 | 57,325 | 58,126 | 64,202 | 61,088 | 63,956 | 62,841 | 58,087 | 60,188 |
| 2024 | 59,896 | 55,621 | ||||||||||
| - = No Data Reported; -- = Not Applicable; NA = Not Available; W = Withheld to avoid disclosure of individual company data. |
| Release Date: 4/30/2024 |
| Next Release Date: 5/31/2024 |