|
Download Data (XLS File) |
|
||||||||
|
||||||||
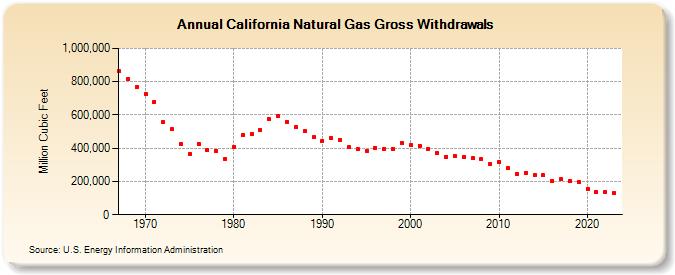
| California Natural Gas Gross Withdrawals (Million Cubic Feet) | ||||||||
| Decade | Year-0 | Year-1 | Year-2 | Year-3 | Year-4 | Year-5 | Year-6 | Year-7 | Year-8 | Year-9 |
|---|---|---|---|---|---|---|---|---|---|---|
| 1960's | 861,320 | 816,925 | 767,342 | |||||||
| 1970's | 727,245 | 679,244 | 555,392 | 513,586 | 426,974 | 367,653 | 427,640 | 387,497 | 383,501 | 337,497 |
| 1980's | 407,151 | 481,833 | 483,914 | 509,414 | 574,638 | 596,368 | 558,324 | 527,486 | 501,044 | 466,493 |
| 1990's | 446,000 | 459,836 | 448,855 | 405,367 | 395,752 | 383,238 | 400,011 | 397,652 | 397,569 | 432,214 |
| 2000's | 418,865 | 414,838 | 397,021 | 368,440 | 348,827 | 352,044 | 349,137 | 339,389 | 333,019 | 306,263 |
| 2010's | 319,891 | 279,130 | 246,822 | 252,310 | 238,988 | 236,648 | 205,025 | 212,458 | 202,617 | 196,823 |
| 2020's | 157,534 | 137,540 | 137,754 | 131,235 |
| - = No Data Reported; -- = Not Applicable; NA = Not Available; W = Withheld to avoid disclosure of individual company data. |
| Release Date: 4/30/2024 |
| Next Release Date: 5/31/2024 |