|
Download Data (XLS File) |
|
||||||||
|
||||||||
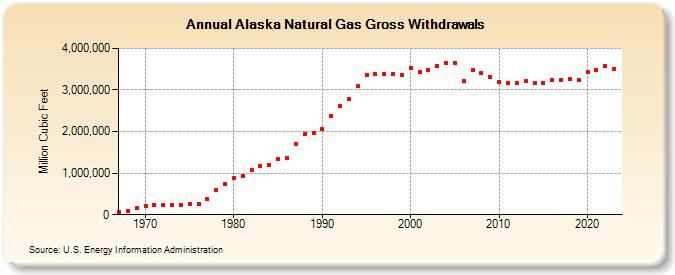
| Alaska Natural Gas Gross Withdrawals (Million Cubic Feet) | ||||||||
| Decade | Year-0 | Year-1 | Year-2 | Year-3 | Year-4 | Year-5 | Year-6 | Year-7 | Year-8 | Year-9 |
|---|---|---|---|---|---|---|---|---|---|---|
| 1960's | 65,817 | 99,303 | 149,647 | |||||||
| 1970's | 217,854 | 228,172 | 222,905 | 223,288 | 229,963 | 253,227 | 269,111 | 373,791 | 596,834 | 732,990 |
| 1980's | 893,759 | 943,059 | 1,084,732 | 1,164,602 | 1,206,370 | 1,343,553 | 1,375,054 | 1,694,870 | 1,933,047 | 1,965,013 |
| 1990's | 2,053,324 | 2,378,896 | 2,625,713 | 2,778,341 | 3,085,900 | 3,369,904 | 3,373,584 | 3,380,950 | 3,378,848 | 3,362,082 |
| 2000's | 3,529,394 | 3,427,779 | 3,477,438 | 3,578,305 | 3,644,084 | 3,642,948 | 3,205,751 | 3,479,290 | 3,415,884 | 3,312,386 |
| 2010's | 3,197,100 | 3,162,922 | 3,164,791 | 3,215,358 | 3,168,545 | 3,175,301 | 3,230,193 | 3,250,769 | 3,254,712 | 3,250,353 |
| 2020's | 3,430,322 | 3,486,056 | 3,586,886 | 3,503,995 | 3,549,165 | 3,546,110 |
| - = No Data Reported; -- = Not Applicable; NA = Not Available; W = Withheld to avoid disclosure of individual company data. |
| Release Date: 6/30/2026 |
| Next Release Date: 7/31/2026 |