|
Download Data (XLS File) |
|
||||||||
|
||||||||
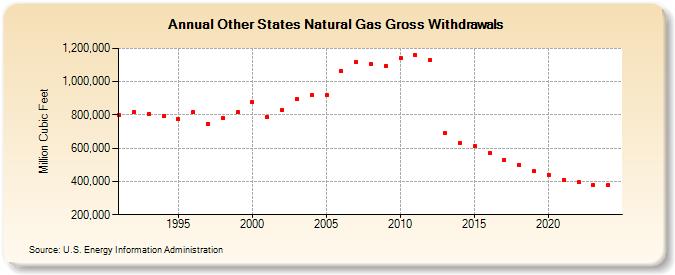
| Other States Natural Gas Gross Withdrawals (Million Cubic Feet) | ||||||||
| Decade | Year-0 | Year-1 | Year-2 | Year-3 | Year-4 | Year-5 | Year-6 | Year-7 | Year-8 | Year-9 |
|---|---|---|---|---|---|---|---|---|---|---|
| 1990's | 798,236 | 818,233 | 807,040 | 793,261 | 774,978 | 815,754 | 747,154 | 784,209 | 815,512 | |
| 2000's | 876,145 | 786,947 | 830,504 | 895,100 | 917,014 | 918,593 | 1,062,942 | 1,120,987 | 1,105,463 | 1,096,701 |
| 2010's | 1,141,561 | 1,161,365 | 1,129,702 | 689,082 | 631,536 | 611,356 | 571,820 | 531,860 | 500,318 | 460,623 |
| 2020's | 440,442 | 409,998 | 398,630 | 376,707 |
| - = No Data Reported; -- = Not Applicable; NA = Not Available; W = Withheld to avoid disclosure of individual company data. |
| Release Date: 4/30/2024 |
| Next Release Date: 5/31/2024 |