|
Download Data (XLS File) |
|
||||||||
|
||||||||
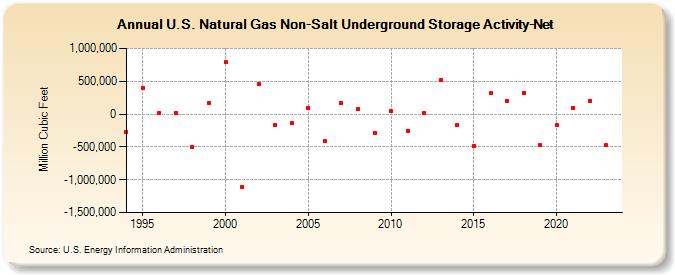
| U.S. Natural Gas Non-Salt Underground Storage Activity-Net (Million Cubic Feet) | ||||||||
| Decade | Year-0 | Year-1 | Year-2 | Year-3 | Year-4 | Year-5 | Year-6 | Year-7 | Year-8 | Year-9 |
|---|---|---|---|---|---|---|---|---|---|---|
| 1990's | -268,751 | 402,800 | 18,357 | 17,583 | -504,459 | 174,595 | ||||
| 2000's | 789,720 | -1,108,085 | 462,952 | -167,008 | -136,407 | 88,771 | -412,451 | 172,092 | 76,017 | -292,710 |
| 2010's | 41,286 | -255,148 | 12,249 | 517,136 | -171,068 | -482,369 | 316,471 | 203,471 | 327,240 | -476,106 |
| 2020's | -163,938 | 95,069 | 200,449 | -476,917 |
| - = No Data Reported; -- = Not Applicable; NA = Not Available; W = Withheld to avoid disclosure of individual company data. |
| Release Date: 3/29/2024 |
| Next Release Date: 4/30/2024 |
Referring Pages: