|
Download Data (XLS File) |
|
||||||||
|
||||||||
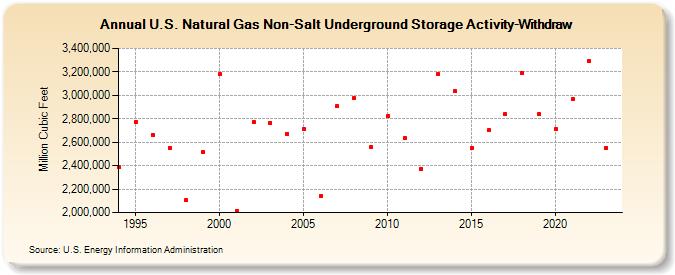
| U.S. Natural Gas Non-Salt Underground Storage Activity-Withdraw (Million Cubic Feet) | ||||||||
| Decade | Year-0 | Year-1 | Year-2 | Year-3 | Year-4 | Year-5 | Year-6 | Year-7 | Year-8 | Year-9 |
|---|---|---|---|---|---|---|---|---|---|---|
| 1990's | 2,385,284 | 2,774,498 | 2,665,481 | 2,550,569 | 2,103,328 | 2,512,452 | ||||
| 2000's | 3,178,089 | 2,015,093 | 2,775,484 | 2,767,743 | 2,673,058 | 2,711,868 | 2,141,041 | 2,904,768 | 2,976,120 | 2,562,957 |
| 2010's | 2,821,989 | 2,633,772 | 2,372,671 | 3,180,654 | 3,033,713 | 2,549,498 | 2,700,453 | 2,838,793 | 3,191,730 | 2,837,550 |
| 2020's | 2,711,231 | 2,968,957 | 3,292,006 | 2,550,943 |
| - = No Data Reported; -- = Not Applicable; NA = Not Available; W = Withheld to avoid disclosure of individual company data. |
| Release Date: 3/29/2024 |
| Next Release Date: 4/30/2024 |
Referring Pages: