|
Download Data (XLS File) |
|
||||||||
|
||||||||
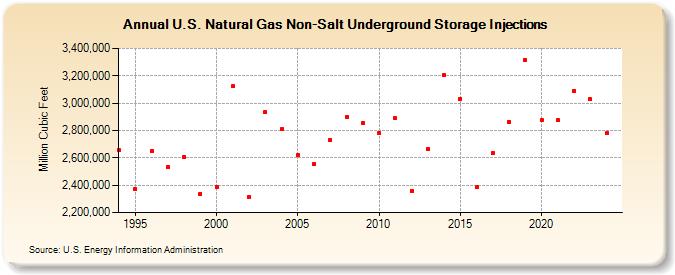
| U.S. Natural Gas Non-Salt Underground Storage Injections (Million Cubic Feet) | ||||||||
| Decade | Year-0 | Year-1 | Year-2 | Year-3 | Year-4 | Year-5 | Year-6 | Year-7 | Year-8 | Year-9 |
|---|---|---|---|---|---|---|---|---|---|---|
| 1990's | 2,654,035 | 2,371,697 | 2,647,124 | 2,532,986 | 2,607,787 | 2,337,857 | ||||
| 2000's | 2,388,369 | 3,123,178 | 2,312,532 | 2,934,751 | 2,809,465 | 2,623,097 | 2,553,493 | 2,732,676 | 2,900,103 | 2,855,667 |
| 2010's | 2,780,703 | 2,888,920 | 2,360,422 | 2,663,518 | 3,204,781 | 3,031,867 | 2,383,982 | 2,635,322 | 2,864,490 | 3,313,656 |
| 2020's | 2,875,169 | 2,873,888 | 3,091,558 | 3,027,859 |
| - = No Data Reported; -- = Not Applicable; NA = Not Available; W = Withheld to avoid disclosure of individual company data. |
| Release Date: 3/29/2024 |
| Next Release Date: 4/30/2024 |
Referring Pages: