|
Download Data (XLS File) |
|
||||||||
|
||||||||
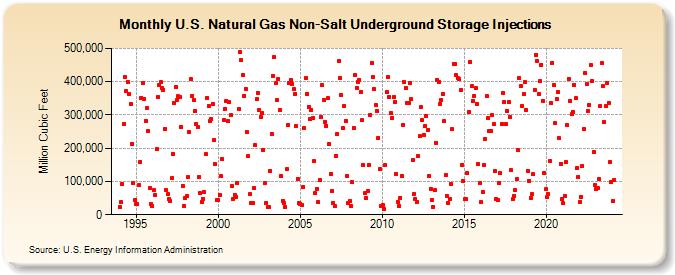
| U.S. Natural Gas Non-Salt Underground Storage Injections (Million Cubic Feet) | ||||||||
| Year | Jan | Feb | Mar | Apr | May | Jun | Jul | Aug | Sep | Oct | Nov | Dec |
|---|---|---|---|---|---|---|---|---|---|---|---|---|
| 1994 | 23,610 | 37,290 | 91,769 | 272,229 | 412,511 | 370,551 | 398,280 | 363,275 | 332,730 | 213,939 | 94,314 | 43,538 |
| 1995 | 30,839 | 30,821 | 88,264 | 159,247 | 351,714 | 395,761 | 348,399 | 282,995 | 319,462 | 252,016 | 79,450 | 32,731 |
| 1996 | 25,996 | 73,383 | 59,375 | 196,997 | 354,267 | 389,563 | 397,787 | 379,756 | 375,662 | 258,861 | 74,521 | 60,957 |
| 1997 | 47,422 | 39,996 | 108,965 | 183,536 | 334,707 | 384,856 | 345,606 | 355,687 | 353,354 | 264,545 | 87,529 | 26,783 |
| 1998 | 51,238 | 56,722 | 112,635 | 249,644 | 407,102 | 357,628 | 345,321 | 311,891 | 273,558 | 263,342 | 114,499 | 64,208 |
| 1999 | 38,695 | 47,084 | 68,665 | 181,533 | 351,657 | 326,986 | 281,583 | 288,182 | 333,841 | 224,232 | 151,411 | 43,988 |
| 2000 | 43,575 | 60,268 | 115,756 | 167,409 | 285,859 | 318,412 | 342,631 | 280,889 | 339,865 | 300,117 | 86,316 | 47,273 |
| 2001 | 60,090 | 54,709 | 95,811 | 316,538 | 490,186 | 463,945 | 421,163 | 357,737 | 378,278 | 247,781 | 175,590 | 61,351 |
| 2002 | 35,511 | 35,847 | 80,322 | 209,294 | 346,374 | 366,147 | 313,949 | 293,347 | 306,213 | 194,157 | 95,324 | 36,048 |
| 2003 | 22,912 | 22,870 | 131,760 | 243,538 | 417,627 | 474,052 | 394,977 | 344,796 | 408,070 | 315,056 | 116,907 | 42,188 |
| 2004 | 34,646 | 22,294 | 136,211 | 269,858 | 396,794 | 405,043 | 393,729 | 376,753 | 363,799 | 266,358 | 108,783 | 35,199 |
| 2005 | 33,064 | 30,468 | 82,100 | 260,135 | 410,996 | 364,067 | 324,083 | 286,830 | 315,861 | 290,903 | 160,371 | 64,219 |
| 2006 | 78,103 | 38,850 | 104,979 | 294,063 | 389,514 | 344,517 | 278,963 | 267,725 | 349,719 | 212,733 | 123,728 | 70,598 |
| 2007 | 34,857 | 24,874 | 177,990 | 241,553 | 461,652 | 411,086 | 359,334 | 260,193 | 327,584 | 282,581 | 116,631 | 34,341 |
| 2008 | 41,102 | 26,886 | 98,100 | 261,564 | 420,083 | 382,098 | 399,980 | 406,142 | 367,875 | 283,890 | 148,540 | 63,844 |
| 2009 | 49,818 | 71,442 | 148,264 | 300,429 | 456,730 | 413,825 | 378,358 | 330,497 | 312,654 | 231,622 | 137,241 | 24,786 |
| 2010 | 29,261 | 16,781 | 148,330 | 367,633 | 414,651 | 353,477 | 305,096 | 291,503 | 353,156 | 338,952 | 123,247 | 38,618 |
| 2011 | 26,669 | 51,364 | 116,866 | 270,000 | 398,938 | 382,039 | 336,619 | 336,223 | 395,236 | 347,147 | 164,990 | 62,829 |
| 2012 | 47,420 | 39,082 | 175,931 | 235,452 | 323,755 | 284,856 | 240,904 | 266,595 | 295,418 | 255,081 | 117,412 | 78,517 |
| 2013 | 43,525 | 24,504 | 73,186 | 216,764 | 406,073 | 400,404 | 333,067 | 344,477 | 363,455 | 280,585 | 119,851 | 57,626 |
| 2014 | 36,633 | 48,338 | 93,185 | 256,235 | 453,718 | 453,904 | 419,668 | 409,781 | 407,691 | 374,860 | 150,117 | 100,652 |
| 2015 | 45,959 | 46,401 | 124,479 | 310,237 | 460,123 | 385,772 | 341,927 | 357,817 | 380,096 | 333,866 | 151,179 | 94,008 |
| 2016 | 37,104 | 69,238 | 148,636 | 228,696 | 356,726 | 290,517 | 250,776 | 252,718 | 299,191 | 271,392 | 130,621 | 48,366 |
| 2017 | 43,867 | 93,933 | 124,303 | 273,105 | 364,870 | 337,707 | 271,876 | 311,155 | 340,143 | 294,564 | 133,120 | 46,678 |
| 2018 | 57,161 | 73,012 | 106,799 | 193,076 | 410,283 | 386,806 | 326,459 | 362,633 | 398,482 | 315,700 | 131,701 | 102,379 |
| 2019 | 49,717 | 62,162 | 121,517 | 376,226 | 481,480 | 463,463 | 364,238 | 401,515 | 450,858 | 342,397 | 123,970 | 76,113 |
| 2020 | 52,000 | 61,363 | 161,246 | 334,844 | 457,489 | 388,882 | 275,196 | 346,471 | 368,624 | 229,399 | 153,437 | 46,217 |
| 2021 | 34,040 | 56,682 | 158,152 | 268,205 | 409,324 | 341,497 | 301,309 | 310,139 | 389,549 | 350,857 | 139,817 | 114,316 |
| 2022 | 38,063 | 54,035 | 147,888 | 258,656 | 426,239 | 393,695 | 311,827 | 330,028 | 450,281 | 401,986 | 189,406 | 89,454 |
| 2023 | 78,206 | 81,047 | 106,902 | 327,062 | 454,873 | 386,066 | 279,069 | 326,477 | 395,856 | 336,299 | 158,216 | 97,788 |
| 2024 | 41,354 | |||||||||||
| - = No Data Reported; -- = Not Applicable; NA = Not Available; W = Withheld to avoid disclosure of individual company data. |
| Release Date: 3/29/2024 |
| Next Release Date: 4/30/2024 |
Referring Pages: