|
Download Data (XLS File) |
|
||||||||
|
||||||||
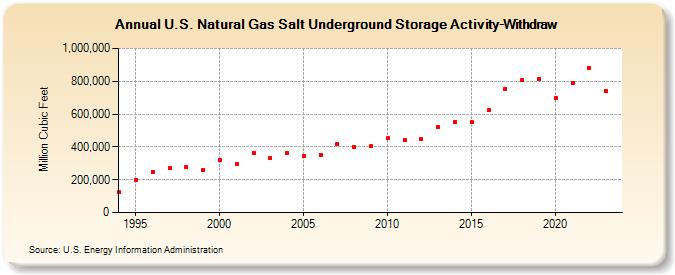
| U.S. Natural Gas Salt Underground Storage Activity-Withdraw (Million Cubic Feet) | ||||||||
| Decade | Year-0 | Year-1 | Year-2 | Year-3 | Year-4 | Year-5 | Year-6 | Year-7 | Year-8 | Year-9 |
|---|---|---|---|---|---|---|---|---|---|---|
| 1990's | 122,867 | 199,604 | 245,846 | 273,676 | 275,329 | 259,083 | ||||
| 2000's | 320,115 | 293,594 | 363,261 | 330,991 | 363,508 | 344,730 | 351,821 | 420,245 | 398,217 | 403,321 |
| 2010's | 452,396 | 440,480 | 445,477 | 520,856 | 552,155 | 550,191 | 624,467 | 751,685 | 807,694 | 815,252 |
| 2020's | 700,675 | 792,162 | 882,628 | 741,474 |
| - = No Data Reported; -- = Not Applicable; NA = Not Available; W = Withheld to avoid disclosure of individual company data. |
| Release Date: 3/29/2024 |
| Next Release Date: 4/30/2024 |
Referring Pages: