|
Download Data (XLS File) |
|
||||||||
|
||||||||
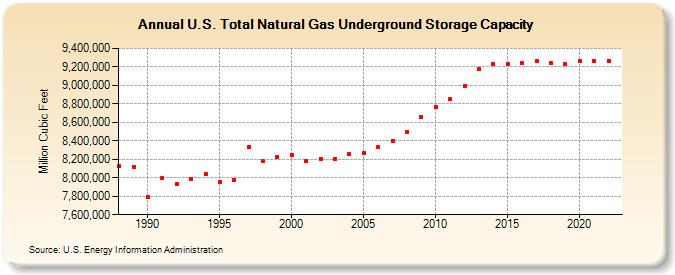
| U.S. Total Natural Gas Underground Storage Capacity (Million Cubic Feet) | ||||||||
| Decade | Year-0 | Year-1 | Year-2 | Year-3 | Year-4 | Year-5 | Year-6 | Year-7 | Year-8 | Year-9 |
|---|---|---|---|---|---|---|---|---|---|---|
| 1980's | 8,124,067 | 8,120,142 | ||||||||
| 1990's | 7,794,083 | 7,993,265 | 7,931,513 | 7,988,856 | 8,042,830 | 7,952,610 | 7,980,400 | 8,331,879 | 8,178,889 | 8,229,259 |
| 2000's | 8,240,886 | 8,182,248 | 8,207,074 | 8,205,716 | 8,255,042 | 8,268,443 | 8,329,967 | 8,402,216 | 8,498,535 | 8,655,740 |
| 2010's | 8,763,798 | 8,849,125 | 8,991,335 | 9,172,951 | 9,233,352 | 9,230,840 | 9,239,042 | 9,260,590 | 9,240,542 | 9,231,237 |
| 2020's | 9,259,491 | 9,264,867 | 9,268,661 | 9,278,223 | 9,319,291 |
| - = No Data Reported; -- = Not Applicable; NA = Not Available; W = Withheld to avoid disclosure of individual company data. |
| Release Date: 2/6/2026 |
| Next Release Date: 2/27/2026 |