|
Download Data (XLS File) |
|
||||||||
|
||||||||
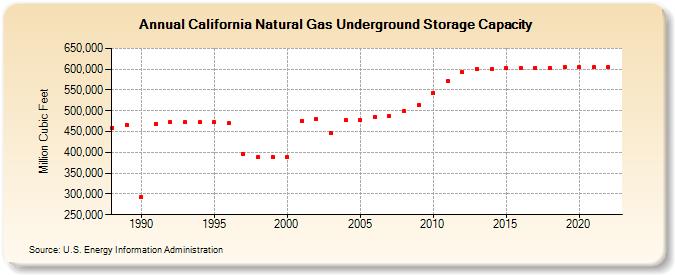
| California Natural Gas Underground Storage Capacity (Million Cubic Feet) | ||||||||
| Decade | Year-0 | Year-1 | Year-2 | Year-3 | Year-4 | Year-5 | Year-6 | Year-7 | Year-8 | Year-9 |
|---|---|---|---|---|---|---|---|---|---|---|
| 1980's | 459,673 | 466,818 | ||||||||
| 1990's | 291,678 | 467,678 | 472,108 | 472,108 | 472,108 | 472,908 | 469,695 | 396,430 | 388,370 | 388,370 |
| 2000's | 388,480 | 476,000 | 478,995 | 446,095 | 478,226 | 477,726 | 484,711 | 487,711 | 498,705 | 513,005 |
| 2010's | 542,511 | 570,511 | 592,411 | 599,711 | 599,711 | 601,808 | 602,008 | 603,808 | 603,808 | 604,048 |
| 2020's | 604,048 | 604,048 | 604,048 |
| - = No Data Reported; -- = Not Applicable; NA = Not Available; W = Withheld to avoid disclosure of individual company data. |
| Release Date: 3/29/2024 |
| Next Release Date: 4/30/2024 |