|
Download Data (XLS File) |
|
|||||
|
|||||
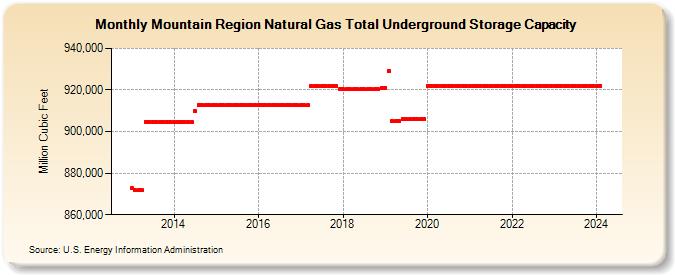
| Mountain Region Natural Gas Total Underground Storage Capacity (Million Cubic Feet) | |||||
| Year | Jan | Feb | Mar | Apr | May | Jun | Jul | Aug | Sep | Oct | Nov | Dec |
|---|---|---|---|---|---|---|---|---|---|---|---|---|
| 2013 | 872,635 | 871,739 | 871,739 | 871,739 | 904,787 | 904,787 | 904,787 | 904,787 | 904,787 | 904,787 | 904,787 | 904,787 |
| 2014 | 904,787 | 904,787 | 904,787 | 904,787 | 904,787 | 904,787 | 909,887 | 912,887 | 912,887 | 912,887 | 912,887 | 912,887 |
| 2015 | 912,887 | 912,887 | 912,887 | 912,887 | 912,941 | 912,941 | 912,941 | 912,941 | 912,931 | 912,931 | 912,931 | 912,931 |
| 2016 | 912,931 | 912,931 | 912,931 | 912,931 | 912,931 | 912,931 | 912,931 | 912,931 | 912,931 | 912,931 | 912,931 | 912,690 |
| 2017 | 912,614 | 912,614 | 912,614 | 921,914 | 921,914 | 921,914 | 921,914 | 921,914 | 921,914 | 921,914 | 921,914 | 920,306 |
| 2018 | 920,306 | 920,306 | 920,306 | 920,306 | 920,306 | 920,306 | 920,306 | 920,306 | 920,306 | 920,306 | 920,306 | 921,086 |
| 2019 | 921,086 | 929,086 | 905,038 | 905,038 | 905,038 | 906,038 | 906,038 | 906,038 | 906,038 | 906,038 | 906,038 | 906,038 |
| 2020 | 922,086 | 922,086 | 922,086 | 922,086 | 922,086 | 922,086 | 922,086 | 922,086 | 922,086 | 922,086 | 922,086 | 922,086 |
| 2021 | 922,086 | 922,086 | 922,086 | 922,086 | 922,086 | 922,086 | 922,086 | 922,086 | 922,086 | 922,086 | 922,086 | 922,086 |
| 2022 | 922,086 | 922,086 | 922,086 | 922,086 | 922,086 | 922,086 | 922,086 | 922,086 | 922,086 | 922,086 | 922,086 | 922,086 |
| 2023 | 922,086 | 922,086 | 922,086 | 922,086 | 922,086 | 922,086 | 922,086 | 922,086 | 922,086 | 922,086 | 922,086 | 922,086 |
| 2024 | 922,086 | |||||||||||
| - = No Data Reported; -- = Not Applicable; NA = Not Available; W = Withheld to avoid disclosure of individual company data. |
| Release Date: 3/29/2024 |
| Next Release Date: 4/30/2024 |