|
Download Data (XLS File) |
|
|||||
|
|||||
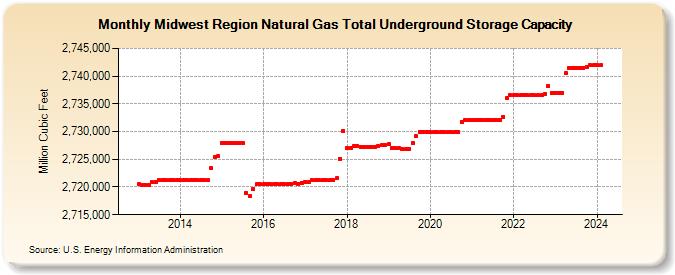
| Midwest Region Natural Gas Total Underground Storage Capacity (Million Cubic Feet) | |||||
| Year | Jan | Feb | Mar | Apr | May | Jun | Jul | Aug | Sep | Oct | Nov | Dec |
|---|---|---|---|---|---|---|---|---|---|---|---|---|
| 2013 | 2,720,465 | 2,720,436 | 2,720,436 | 2,720,436 | 2,720,881 | 2,720,881 | 2,721,231 | 2,721,231 | 2,721,231 | 2,721,231 | 2,721,231 | 2,721,231 |
| 2014 | 2,721,231 | 2,721,231 | 2,721,231 | 2,721,231 | 2,721,231 | 2,721,231 | 2,721,231 | 2,721,231 | 2,721,231 | 2,723,336 | 2,725,497 | 2,725,535 |
| 2015 | 2,727,987 | 2,727,987 | 2,727,987 | 2,727,987 | 2,727,987 | 2,727,987 | 2,727,987 | 2,718,987 | 2,718,288 | 2,719,655 | 2,720,487 | 2,720,487 |
| 2016 | 2,720,487 | 2,720,487 | 2,720,487 | 2,720,487 | 2,720,487 | 2,720,517 | 2,720,517 | 2,720,517 | 2,720,517 | 2,720,718 | 2,720,598 | 2,720,798 |
| 2017 | 2,720,938 | 2,720,938 | 2,721,215 | 2,721,215 | 2,721,215 | 2,721,215 | 2,721,215 | 2,721,215 | 2,721,215 | 2,721,543 | 2,725,119 | 2,730,105 |
| 2018 | 2,727,074 | 2,727,068 | 2,727,368 | 2,727,368 | 2,727,265 | 2,727,265 | 2,727,265 | 2,727,265 | 2,727,265 | 2,727,395 | 2,727,496 | 2,727,598 |
| 2019 | 2,727,748 | 2,726,993 | 2,726,993 | 2,726,993 | 2,726,843 | 2,726,843 | 2,726,843 | 2,727,943 | 2,729,143 | 2,729,923 | 2,729,973 | 2,729,939 |
| 2020 | 2,729,876 | 2,729,876 | 2,729,876 | 2,729,876 | 2,729,876 | 2,729,876 | 2,729,876 | 2,729,876 | 2,729,876 | 2,731,798 | 2,732,068 | 2,732,146 |
| 2021 | 2,732,146 | 2,732,146 | 2,732,146 | 2,732,146 | 2,732,146 | 2,732,146 | 2,732,146 | 2,732,146 | 2,732,146 | 2,732,647 | 2,736,037 | 2,736,515 |
| 2022 | 2,736,515 | 2,736,515 | 2,736,515 | 2,736,515 | 2,736,515 | 2,736,515 | 2,736,515 | 2,736,515 | 2,736,515 | 2,736,745 | 2,738,266 | 2,737,037 |
| 2023 | 2,737,037 | 2,737,037 | 2,737,037 | 2,740,513 | 2,741,523 | 2,741,523 | 2,741,523 | 2,741,523 | 2,741,523 | 2,741,726 | 2,741,926 | 2,741,938 |
| 2024 | 2,741,938 | |||||||||||
| - = No Data Reported; -- = Not Applicable; NA = Not Available; W = Withheld to avoid disclosure of individual company data. |
| Release Date: 3/29/2024 |
| Next Release Date: 4/30/2024 |