|
Download Data (XLS File) |
|
||||||||
|
||||||||
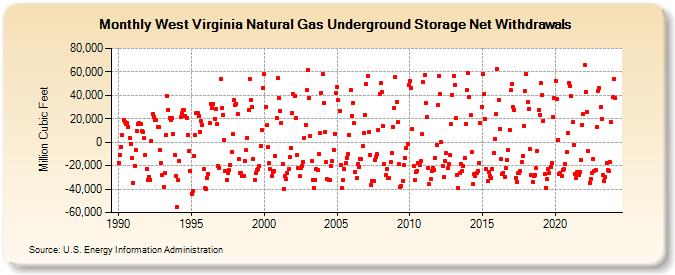
| West Virginia Natural Gas Underground Storage Net Withdrawals (Million Cubic Feet) | ||||||||
| Year | Jan | Feb | Mar | Apr | May | Jun | Jul | Aug | Sep | Oct | Nov | Dec |
|---|---|---|---|---|---|---|---|---|---|---|---|---|
| 1990 | -17,409 | -11,274 | -4,292 | 6,208 | 18,841 | 17,270 | 15,890 | 16,021 | 13,295 | 3,711 | -1,220 | -13,381 |
| 1991 | -34,709 | -20,279 | -6,805 | 9,715 | 15,360 | 16,310 | 15,495 | 9,816 | 8,516 | 3,606 | -11,077 | -22,834 |
| 1992 | -32,275 | -29,522 | -32,072 | 1,169 | 24,410 | 21,294 | 19,023 | 18,576 | 13,281 | 12,723 | -6,875 | -17,912 |
| 1993 | -28,369 | -37,924 | -25,933 | 6,019 | 39,451 | 27,877 | 20,466 | 18,915 | 20,560 | 7,369 | -10,806 | -29,010 |
| 1994 | -55,049 | -32,236 | -16,043 | 21,190 | 25,170 | 27,657 | 27,180 | 22,343 | 20,918 | 5,989 | -7,389 | -24,797 |
| 1995 | -43,839 | -41,395 | -12,156 | 5,825 | 24,639 | 24,564 | 22,284 | 8,978 | 17,855 | 14,545 | -23,047 | -39,382 |
| 1996 | -39,816 | -30,318 | -26,887 | 16,242 | 32,767 | 29,535 | 32,686 | 19,913 | 28,009 | 15,242 | -19,884 | -21,644 |
| 1997 | 53,582 | 28,818 | 23,270 | 1,674 | -24,165 | -31,856 | -26,183 | -24,119 | -19,091 | -8,145 | 6,615 | 36,318 |
| 1998 | 32,069 | 32,869 | 23,897 | -14,668 | -26,087 | -26,455 | -28,626 | -29,122 | -16,431 | -6,935 | 3,983 | 27,238 |
| 1999 | 53,957 | 36,277 | 30,268 | -14,007 | -32,055 | -26,485 | -23,750 | -23,063 | -20,427 | -3,320 | 10,665 | 46,561 |
| 2000 | 57,780 | 30,364 | 14,445 | -4,493 | -18,097 | -23,246 | -29,171 | -25,366 | -24,203 | -11,762 | 20,788 | 55,132 |
| 2001 | 37,630 | 26,401 | 16,567 | -18,286 | -39,574 | -28,873 | -31,342 | -25,976 | -22,526 | -12,943 | -5,366 | 25,054 |
| 2002 | 41,181 | 39,246 | 20,713 | -10,523 | -21,680 | -29,160 | -22,210 | -20,179 | -16,504 | 3,608 | 14,615 | 44,193 |
| 2003 | 61,978 | 37,668 | 5,161 | -16,008 | -32,162 | -38,730 | -32,032 | -22,726 | -24,067 | -9,676 | 7,466 | 42,314 |
| 2004 | 58,367 | 33,624 | 8,687 | -17,117 | -31,726 | -32,074 | -32,220 | -20,419 | -16,138 | -6,327 | 7,408 | 41,575 |
| 2005 | 47,424 | 35,682 | 26,312 | -19,106 | -39,030 | -32,274 | -22,953 | -17,956 | -13,083 | -10,270 | 5,761 | 44,412 |
| 2006 | 22,267 | 33,553 | 16,038 | -25,322 | -30,516 | -18,748 | -21,495 | -14,208 | -13,955 | -3,128 | 7,800 | 23,291 |
| 2007 | 49,514 | 56,709 | 8,441 | -10,912 | -36,476 | -32,734 | -32,818 | -14,904 | -12,984 | -10,442 | 10,462 | 40,684 |
| 2008 | 50,393 | 42,436 | 13,785 | -18,373 | -27,719 | -22,565 | -30,912 | -30,318 | -17,204 | -8,932 | 13,101 | 29,059 |
| 2009 | 55,377 | 34,584 | 17,279 | -18,776 | -37,870 | -37,040 | -32,989 | -19,629 | -13,233 | -4,824 | -1,643 | 48,590 |
| 2010 | 52,422 | 46,605 | 10,913 | -20,364 | -32,303 | -24,998 | -24,267 | -17,838 | -19,686 | -15,972 | 6,585 | 51,035 |
| 2011 | 57,081 | 33,075 | 21,805 | -22,095 | -36,024 | -31,401 | -24,775 | -21,605 | -23,867 | -13,360 | -2,739 | 31,602 |
| 2012 | 56,835 | 41,289 | -4 | -20,058 | -29,888 | -15,801 | -9,294 | -22,298 | -18,574 | -10,984 | 15,300 | 40,436 |
| 2013 | 56,307 | 49,178 | 20,330 | -27,624 | -39,259 | -26,611 | -18,503 | -24,339 | -20,606 | -13,062 | 15,128 | 44,104 |
| 2014 | 59,366 | 38,330 | 22,841 | -8,421 | -35,829 | -27,051 | -28,904 | -25,969 | -24,144 | -17,465 | 16,358 | 30,123 |
| 2015 | 58,043 | 41,243 | 19,424 | -23,204 | -33,369 | -25,786 | -28,865 | -30,326 | -22,829 | -9,191 | 2,855 | 23,857 |
| 2016 | 62,059 | 35,666 | 11,571 | -14,249 | -27,301 | -25,938 | -29,308 | -22,388 | -15,425 | -7,057 | 10,686 | 44,092 |
| 2017 | 49,893 | 29,958 | 27,775 | -30,240 | -33,844 | -26,523 | -26,009 | -24,959 | -17,030 | -11,598 | 13,698 | 43,252 |
| 2018 | 58,248 | 33,907 | 28,590 | -6,014 | -28,088 | -33,562 | -29,175 | -28,124 | -22,336 | -7,429 | 27,577 | 23,533 |
| 2019 | 50,155 | 39,896 | 18,400 | -27,036 | -38,734 | -31,677 | -22,905 | -26,666 | -21,341 | -17,448 | 21,547 | 37,597 |
| 2020 | 51,885 | 36,954 | 2,249 | -26,952 | -26,222 | -28,495 | -23,394 | -23,060 | -18,786 | -8,676 | 8,073 | 50,513 |
| 2021 | 47,695 | 39,167 | 17,293 | -2,759 | -26,753 | -30,691 | -25,076 | -28,034 | -25,189 | -15,345 | 15,065 | 24,111 |
| 2022 | 65,806 | 42,836 | 25,541 | -7,529 | -34,789 | -31,235 | -26,273 | -14,718 | -24,699 | -23,522 | 13,280 | 43,497 |
| 2023 | 45,908 | 29,910 | 20,020 | -27,666 | -32,845 | -29,799 | -17,370 | -23,520 | -24,820 | -17,254 | 17,454 | 38,633 |
| 2024 | 54,309 | 37,670 | ||||||||||
| - = No Data Reported; -- = Not Applicable; NA = Not Available; W = Withheld to avoid disclosure of individual company data. |
| Release Date: 4/30/2024 |
| Next Release Date: 5/31/2024 |