|
Download Data (XLS File) |
|
||||||||
|
||||||||
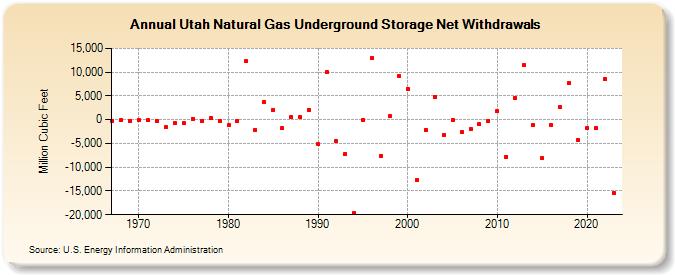
| Utah Natural Gas Underground Storage Net Withdrawals (Million Cubic Feet) | ||||||||
| Decade | Year-0 | Year-1 | Year-2 | Year-3 | Year-4 | Year-5 | Year-6 | Year-7 | Year-8 | Year-9 |
|---|---|---|---|---|---|---|---|---|---|---|
| 1960's | -220 | -29 | -213 | |||||||
| 1970's | -108 | -155 | -215 | -1,627 | -682 | -738 | 228 | -330 | 266 | -227 |
| 1980's | -1,191 | -197 | 12,280 | -2,124 | 3,697 | 2,067 | -1,854 | 547 | 533 | 1,984 |
| 1990's | -5,196 | 9,976 | -4,482 | -7,271 | -19,587 | -118 | 12,955 | -7,571 | 676 | 9,193 |
| 2000's | 6,537 | -12,738 | -2,118 | 4,694 | -3,270 | -106 | -2,608 | -2,005 | -1,005 | -293 |
| 2010's | 1,769 | -7,772 | 4,530 | 11,540 | -1,155 | -8,073 | -1,208 | 2,594 | 7,760 | -4,277 |
| 2020's | -1,753 | -1,762 | 8,512 | -15,436 |
| - = No Data Reported; -- = Not Applicable; NA = Not Available; W = Withheld to avoid disclosure of individual company data. |
| Release Date: 3/29/2024 |
| Next Release Date: 4/30/2024 |