|
Download Data (XLS File) |
|
||||||||
|
||||||||
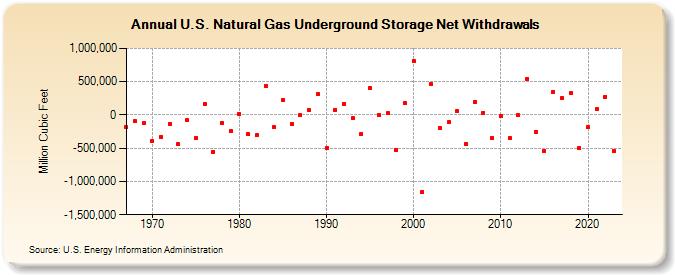
| U.S. Natural Gas Underground Storage Net Withdrawals (Million Cubic Feet) | ||||||||
| Decade | Year-0 | Year-1 | Year-2 | Year-3 | Year-4 | Year-5 | Year-6 | Year-7 | Year-8 | Year-9 |
|---|---|---|---|---|---|---|---|---|---|---|
| 1960's | -184,829 | -95,539 | -116,919 | |||||||
| 1970's | -398,160 | -331,768 | -135,734 | -441,504 | -83,663 | -344,054 | 165,327 | -556,631 | -120,237 | -248,034 |
| 1980's | 13,618 | -292,743 | -305,711 | 441,602 | -188,055 | 231,473 | -140,406 | -6,159 | 69,293 | 312,505 |
| 1990's | -499,663 | 80,355 | 168,381 | -42,674 | -288,127 | 408,220 | 5,735 | 23,950 | -526,099 | 174,025 |
| 2000's | 813,920 | -1,155,575 | 467,822 | -192,981 | -113,437 | 55,016 | -431,387 | 192,093 | 33,973 | -348,719 |
| 2010's | -17,009 | -347,562 | -7,279 | 545,848 | -252,958 | -538,651 | 348,198 | 253,844 | 323,511 | -499,719 |
| 2020's | -177,885 | 83,185 | 276,818 | -547,598 |
| - = No Data Reported; -- = Not Applicable; NA = Not Available; W = Withheld to avoid disclosure of individual company data. |
| Release Date: 3/29/2024 |
| Next Release Date: 4/30/2024 |