|
Download Data (XLS File) |
|
||||||||
|
||||||||
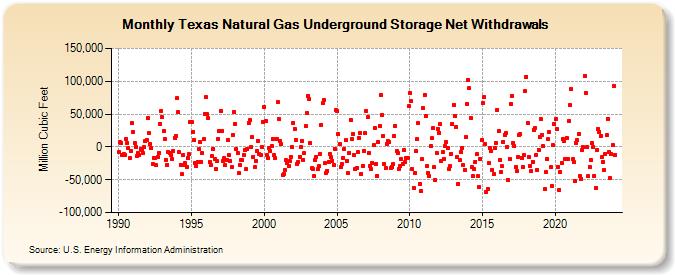
| Texas Natural Gas Underground Storage Net Withdrawals (Million Cubic Feet) | ||||||||
| Year | Jan | Feb | Mar | Apr | May | Jun | Jul | Aug | Sep | Oct | Nov | Dec |
|---|---|---|---|---|---|---|---|---|---|---|---|---|
| 1990 | -8,367 | 6,759 | 5,750 | -12,219 | -10,652 | -12,028 | 12,128 | 6,659 | -1,052 | -17,164 | -6,384 | 36,035 |
| 1991 | 22,767 | 5,721 | 373 | -13,421 | -8,977 | -12,883 | -2,660 | -4,559 | -10,004 | -856 | 8,300 | 9,801 |
| 1992 | 43,357 | 20,462 | 4,693 | -2,096 | -26,278 | -16,212 | -17,447 | -28,309 | -15,735 | -9,677 | 35,326 | 55,358 |
| 1993 | 45,059 | 24,570 | 12,043 | -19,293 | -27,373 | -8,069 | -9,450 | -12,286 | -18,214 | -6,934 | 13,647 | 16,958 |
| 1994 | 73,979 | 52,993 | -8,307 | -27,458 | -41,962 | -12,148 | -27,928 | -25,090 | -30,517 | -17,141 | -11,223 | 38,575 |
| 1995 | 37,692 | 22,672 | 10,188 | -24,870 | -28,366 | -22,690 | -3,685 | 6,956 | -22,880 | -9,871 | 11,542 | 49,476 |
| 1996 | 75,427 | 49,673 | 43,870 | -22,764 | -28,071 | -13,902 | -2,670 | -18,108 | -34,225 | -22,072 | 12,557 | 24,153 |
| 1997 | 54,826 | 24,835 | -21,279 | -17,396 | -28,071 | -20,379 | 10,561 | -12,881 | -21,731 | -30,600 | 18,531 | 53,619 |
| 1998 | 35,289 | -3,634 | -8,935 | -40,175 | -27,224 | -20,094 | -20,397 | -12,193 | -4,692 | -34,274 | -2,512 | 36,724 |
| 1999 | 40,340 | 6 | 14,518 | -14,800 | -31,047 | -21,731 | -6,126 | 9,511 | -10,456 | -12,103 | -652 | 38,524 |
| 2000 | 60,715 | 39,612 | -12,440 | -17,066 | -1,260 | -6,612 | 1,215 | 12,106 | -12,544 | -16,995 | 12,680 | 67,839 |
| 2001 | 42,374 | 9,199 | 3,787 | -42,953 | -40,915 | -34,494 | -20,644 | -23,960 | -28,804 | -21,142 | -15,137 | -55 |
| 2002 | 37,042 | 27,618 | 10,325 | -25,964 | -22,455 | -14,895 | -116 | 9,058 | -19,944 | -9,816 | 31,687 | 51,271 |
| 2003 | 78,182 | 72,434 | 5,825 | -32,790 | -34,335 | -44,612 | -20,073 | -14,802 | -33,763 | -29,673 | -10,501 | 33,604 |
| 2004 | 66,470 | 72,040 | -25,237 | -39,244 | -36,463 | -22,720 | -10,644 | -16,003 | -21,066 | -27,744 | -2,751 | 55,725 |
| 2005 | 54,688 | 19,406 | 3,843 | -30,730 | -25,913 | -16,410 | -2,575 | 10,168 | -20,750 | -40,276 | -8,647 | 41,133 |
| 2006 | 11,644 | 19,677 | -12,715 | -34,328 | -31,696 | -7,875 | 13,653 | 20,833 | -40,828 | -29,278 | -5,877 | 20,831 |
| 2007 | 54,356 | 44,769 | -9,072 | -29,143 | -33,462 | -23,976 | 2,624 | 28,975 | -25,338 | -43,688 | 7,230 | 31,645 |
| 2008 | 78,751 | 49,291 | 17,290 | -26,101 | -32,404 | 4,723 | 8,818 | 6,737 | -31,789 | -30,150 | -26,630 | 17,298 |
| 2009 | 31,636 | -6,246 | -9,111 | -33,080 | -29,373 | -18,648 | -25,433 | -4,733 | -23,449 | -16,246 | -16,531 | 61,606 |
| 2010 | 82,718 | 69,208 | -33,820 | -61,986 | -40,071 | -5,882 | 11,588 | 35,774 | -56,042 | -67,309 | -18,302 | 58,499 |
| 2011 | 79,306 | 46,527 | -29,521 | -39,980 | -44,446 | 1,109 | 12,799 | 28,362 | -30,865 | -50,263 | -8,927 | 27,805 |
| 2012 | 21,567 | 34,311 | -21,710 | -8,166 | -18,334 | 689 | 7,344 | -1,157 | -33,460 | -29,576 | -10,690 | 34,807 |
| 2013 | 64,318 | 46,717 | 30,658 | -15,604 | -56,036 | -20,577 | -7,198 | -1,804 | -28,102 | -35,037 | 14,969 | 65,595 |
| 2014 | 102,009 | 89,138 | 44,718 | -30,409 | -44,996 | -33,940 | -22,245 | -11,235 | -44,441 | -60,721 | -17,967 | 10,548 |
| 2015 | 66,265 | 75,241 | 4,146 | -68,034 | -64,583 | -23,854 | -1,462 | -6,397 | -35,276 | -41,913 | -2,086 | 6,424 |
| 2016 | 56,721 | 24,128 | -19,445 | -38,115 | -29,546 | 7,624 | 18,530 | 21,348 | 112 | -50,646 | -17,919 | 65,863 |
| 2017 | 78,122 | 6,329 | 1,147 | -30,805 | -37,200 | -15,267 | 18,244 | 19,068 | -16,898 | -30,361 | -11,751 | 84,716 |
| 2018 | 107,134 | 36,356 | -15,080 | -28,408 | -37,196 | -22,377 | 26,156 | 28,909 | -12,209 | -35,252 | -3,988 | 15,521 |
| 2019 | 42,024 | 18,399 | 1,132 | -64,861 | -38,598 | -18,342 | 11,375 | 22,555 | -31,098 | -59,099 | 2,360 | 34,819 |
| 2020 | 42,711 | 27,121 | -30,105 | -65,511 | -38,554 | -24,368 | 11,730 | 8,451 | -18,300 | 13,464 | -17,889 | 40,026 |
| 2021 | 63,252 | 87,938 | -19,159 | -23,764 | -52,373 | 5,963 | 9,832 | 20,036 | -44,566 | -48,507 | -5,385 | -634 |
| 2022 | 108,055 | 82,357 | -221 | -44,712 | -30,876 | -20,141 | 5,761 | 378 | -43,934 | -62,435 | -4,110 | 27,534 |
| 2023 | 23,014 | 16,095 | -16,136 | -22,389 | -34,464 | -10,724 | 17,484 | 43,004 | -7,312 | -47,981 | -11,057 | 2,763 |
| 2024 | 93,407 | |||||||||||
| - = No Data Reported; -- = Not Applicable; NA = Not Available; W = Withheld to avoid disclosure of individual company data. |
| Release Date: 3/29/2024 |
| Next Release Date: 4/30/2024 |