|
Download Data (XLS File) |
|
||||||||
|
||||||||
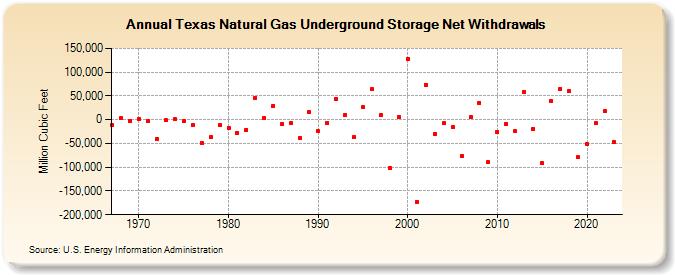
| Texas Natural Gas Underground Storage Net Withdrawals (Million Cubic Feet) | ||||||||
| Decade | Year-0 | Year-1 | Year-2 | Year-3 | Year-4 | Year-5 | Year-6 | Year-7 | Year-8 | Year-9 |
|---|---|---|---|---|---|---|---|---|---|---|
| 1960's | -11,069 | 2,645 | -3,361 | |||||||
| 1970's | 924 | -2,398 | -39,982 | -1,404 | 604 | -3,532 | -11,560 | -48,885 | -37,381 | -11,319 |
| 1980's | -17,058 | -27,478 | -21,146 | 46,461 | 3,726 | 28,994 | -8,300 | -6,811 | -38,989 | 15,935 |
| 1990's | -24,789 | -6,398 | 43,441 | 10,658 | -36,228 | 26,165 | 63,869 | 10,035 | -102,117 | 5,985 |
| 2000's | 127,251 | -172,746 | 73,811 | -30,502 | -7,636 | -16,061 | -75,958 | 4,918 | 35,835 | -89,608 |
| 2010's | -25,622 | -8,093 | -24,376 | 57,900 | -19,539 | -91,530 | 38,656 | 65,344 | 59,567 | -79,335 |
| 2020's | -51,225 | -7,367 | 17,656 | -47,701 |
| - = No Data Reported; -- = Not Applicable; NA = Not Available; W = Withheld to avoid disclosure of individual company data. |
| Release Date: 3/29/2024 |
| Next Release Date: 4/30/2024 |