|
Download Data (XLS File) |
|
||||||||
|
||||||||
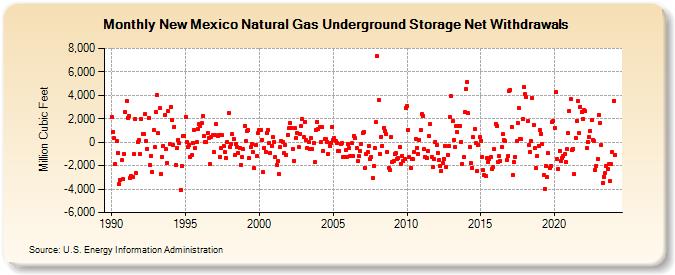
| New Mexico Natural Gas Underground Storage Net Withdrawals (Million Cubic Feet) | ||||||||
| Year | Jan | Feb | Mar | Apr | May | Jun | Jul | Aug | Sep | Oct | Nov | Dec |
|---|---|---|---|---|---|---|---|---|---|---|---|---|
| 1990 | 2,160 | 873 | 320 | -1,825 | 111 | -889 | -3,581 | -3,193 | -1,559 | -3,167 | -1,010 | 2,535 |
| 1991 | 3,502 | 2,091 | 2,218 | -3,039 | -2,909 | -2,998 | -1,031 | 1,960 | -2,642 | 9 | 147 | -1,002 |
| 1992 | 2,019 | 710 | 734 | 2,400 | 95 | -542 | 2,103 | -1,949 | -1,172 | -2,559 | 1,036 | -417 |
| 1993 | 2,590 | 3,995 | 781 | 2,902 | -2,710 | -1,235 | -285 | 2,300 | -602 | -1,795 | 2,650 | -164 |
| 1994 | 3,002 | 1,920 | -279 | 1,338 | -1,937 | -493 | 194 | -105 | -4,075 | -2,020 | 548 | 529 |
| 1995 | 2,171 | 17 | -451 | -233 | -1,245 | -1,130 | -41 | 1,063 | -505 | -20 | 1,120 | 1,527 |
| 1996 | 1,370 | 1,614 | 2,200 | 519 | 21 | 48 | 811 | 363 | -1,873 | 482 | 607 | -823 |
| 1997 | 591 | 1,527 | 501 | 583 | -1,228 | -534 | 587 | -328 | -853 | -1,305 | 25 | 2,500 |
| 1998 | -412 | -130 | 658 | 287 | -1,120 | -180 | -429 | -919 | -470 | -1,903 | -1,243 | -619 |
| 1999 | 1,365 | 83 | 943 | 1,025 | -1,371 | -443 | -172 | -841 | -2,232 | -259 | -1,202 | 814 |
| 2000 | 1,032 | 1,034 | 209 | -2,583 | -468 | -793 | 800 | 1,040 | -50 | -905 | -295 | 418 |
| 2001 | 47 | -1,255 | -1,925 | -1,640 | -2,718 | -430 | 83 | 6 | -932 | -206 | -1,107 | 651 |
| 2002 | 1,180 | 1,657 | 1,202 | -597 | -1,561 | 1,176 | 352 | 791 | -446 | 740 | 1,366 | 1,956 |
| 2003 | 424 | 1,728 | 184 | -471 | 45 | -605 | 346 | -619 | -30 | -1,726 | 1,082 | 1,750 |
| 2004 | 1,084 | 1,276 | 14 | 1,267 | -770 | 248 | 249 | 13 | -987 | -295 | -55 | 1,288 |
| 2005 | 214 | 341 | 116 | -45 | -760 | -722 | -119 | -86 | -1,246 | -1,248 | -704 | -1,236 |
| 2006 | -154 | -494 | -1,216 | -104 | -1,149 | 563 | 326 | -484 | -1,639 | -1,208 | -765 | -126 |
| 2007 | 824 | 905 | -2,179 | -1,045 | -839 | -288 | -1,453 | -1,222 | -3,055 | -2,037 | -521 | 1,684 |
| 2008 | 7,311 | 3,592 | -994 | 474 | -291 | 1,217 | 971 | 692 | -832 | -2,160 | -2,371 | 452 |
| 2009 | -1,718 | -1,604 | -1,036 | -961 | -1,428 | -1,364 | -421 | -1,874 | -1,161 | -1,632 | -1,393 | 2,942 |
| 2010 | 3,082 | 1,045 | -1,276 | -2,182 | -1,438 | -1,463 | -832 | 266 | -464 | -969 | 214 | 1,051 |
| 2011 | 2,387 | 2,250 | -589 | -1,231 | -1,369 | -731 | 514 | 1,523 | -1,267 | -2,113 | -1,425 | 23 |
| 2012 | -267 | -900 | -1,526 | -2,014 | -2,414 | -1,816 | -1,412 | -297 | -2,112 | -1,094 | -339 | 2,115 |
| 2013 | 3,905 | 1,784 | 165 | -380 | 1,394 | 840 | 1,388 | 1,395 | 57 | -1,851 | -1,298 | 2,545 |
| 2014 | 4,559 | 5,131 | 2,453 | -399 | -1,792 | -2,165 | 401 | 1,099 | -41 | -2,469 | -200 | 440 |
| 2015 | 131 | -1,237 | -2,404 | -2,771 | -2,874 | -1,306 | -1,726 | -1,429 | -1,275 | -2,258 | -2,132 | -616 |
| 2016 | 1,568 | 1,413 | -1,658 | -1,170 | -1,615 | -391 | 659 | 167 | 75 | -1,530 | -1,195 | 4,345 |
| 2017 | 4,466 | 1,321 | -2,779 | -1,704 | -1,257 | 68 | 1,623 | 2,883 | 241 | 235 | 1,939 | 4,715 |
| 2018 | 4,077 | 3,846 | 1,785 | -258 | -818 | 93 | 3,751 | 1,475 | -488 | -2,223 | -1,194 | -302 |
| 2019 | 1,041 | 727 | -148 | -2,805 | -3,961 | -2,008 | -2,974 | -938 | -2,162 | -2,024 | 1,682 | 1,790 |
| 2020 | 1,221 | 4,273 | -1,466 | -2,284 | -721 | -1,626 | -1,374 | -1,183 | -1,008 | -1,665 | -604 | 759 |
| 2021 | 2,692 | 3,642 | -670 | -570 | -2,730 | 377 | 1,835 | 3,510 | 750 | 3,013 | 2,608 | 2,009 |
| 2022 | 2,706 | 2,628 | -514 | 54 | 441 | 935 | 1,887 | 217 | 69 | -2,381 | -2,002 | -1,425 |
| 2023 | 2,336 | 1,656 | -258 | -3,470 | -2,932 | -2,638 | -2,032 | -2,255 | -1,850 | -3,336 | -1,855 | -868 |
| 2024 | 3,542 | -1,089 | ||||||||||
| - = No Data Reported; -- = Not Applicable; NA = Not Available; W = Withheld to avoid disclosure of individual company data. |
| Release Date: 4/30/2024 |
| Next Release Date: 5/31/2024 |