|
Download Data (XLS File) |
|
||||||||
|
||||||||
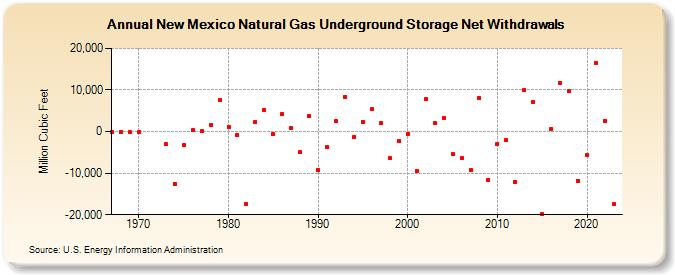
| New Mexico Natural Gas Underground Storage Net Withdrawals (Million Cubic Feet) | ||||||||
| Decade | Year-0 | Year-1 | Year-2 | Year-3 | Year-4 | Year-5 | Year-6 | Year-7 | Year-8 | Year-9 |
|---|---|---|---|---|---|---|---|---|---|---|
| 1960's | -218 | -14 | -218 | |||||||
| 1970's | -157 | -3,043 | -12,531 | -3,310 | 271 | 74 | 1,573 | 7,648 | ||
| 1980's | 1,118 | -821 | -17,411 | 2,387 | 5,069 | -680 | 4,198 | 877 | -4,996 | 3,739 |
| 1990's | -9,226 | -3,694 | 2,458 | 8,426 | -1,379 | 2,273 | 5,338 | 2,065 | -6,479 | -2,289 |
| 2000's | -561 | -9,425 | 7,815 | 2,108 | 3,330 | -5,497 | -6,450 | -9,228 | 8,061 | -11,649 |
| 2010's | -2,967 | -2,028 | -12,074 | 9,944 | 7,015 | -19,897 | 669 | 11,752 | 9,745 | -11,780 |
| 2020's | -5,680 | 16,465 | 2,615 | -17,502 |
| - = No Data Reported; -- = Not Applicable; NA = Not Available; W = Withheld to avoid disclosure of individual company data. |
| Release Date: 4/30/2024 |
| Next Release Date: 5/31/2024 |