|
Download Data (XLS File) |
|
||||||||
|
||||||||
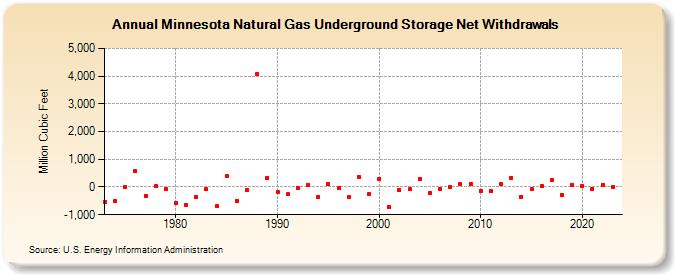
| Minnesota Natural Gas Underground Storage Net Withdrawals (Million Cubic Feet) | ||||||||
| Decade | Year-0 | Year-1 | Year-2 | Year-3 | Year-4 | Year-5 | Year-6 | Year-7 | Year-8 | Year-9 |
|---|---|---|---|---|---|---|---|---|---|---|
| 1970's | -531 | -523 | 4 | 560 | -323 | 19 | -69 | |||
| 1980's | -591 | -648 | -369 | -87 | -696 | 410 | -500 | -107 | 4,068 | 330 |
| 1990's | -179 | -267 | -43 | 72 | -365 | 104 | -30 | -373 | 372 | -253 |
| 2000's | 306 | -713 | -98 | -86 | 297 | -216 | -62 | 14 | 99 | 118 |
| 2010's | -135 | -144 | 105 | 328 | -364 | -78 | 38 | 248 | -274 | 75 |
| 2020's | 51 | -55 | 89 | -4 |
| - = No Data Reported; -- = Not Applicable; NA = Not Available; W = Withheld to avoid disclosure of individual company data. |
| Release Date: 4/30/2024 |
| Next Release Date: 5/31/2024 |