|
Download Data (XLS File) |
|
||||||||
|
||||||||
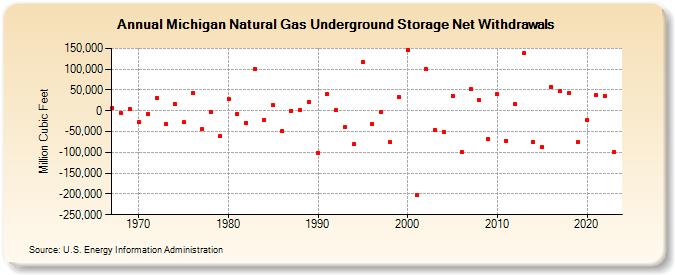
| Michigan Natural Gas Underground Storage Net Withdrawals (Million Cubic Feet) | ||||||||
| Decade | Year-0 | Year-1 | Year-2 | Year-3 | Year-4 | Year-5 | Year-6 | Year-7 | Year-8 | Year-9 |
|---|---|---|---|---|---|---|---|---|---|---|
| 1960's | 7,152 | -4,491 | 3,244 | |||||||
| 1970's | -27,127 | -6,876 | 31,031 | -31,695 | 17,316 | -28,093 | 42,463 | -44,782 | -4,039 | -61,536 |
| 1980's | 27,333 | -7,319 | -29,170 | 100,847 | -21,140 | 13,008 | -48,929 | 461 | 823 | 21,688 |
| 1990's | -100,848 | 39,200 | 2,251 | -39,033 | -80,996 | 117,409 | -31,671 | -3,388 | -74,840 | 32,938 |
| 2000's | 146,588 | -203,022 | 99,889 | -46,488 | -50,223 | 36,242 | -98,738 | 51,912 | 24,762 | -68,275 |
| 2010's | 40,950 | -71,876 | 15,239 | 137,820 | -75,432 | -87,722 | 57,601 | 47,361 | 43,376 | -74,588 |
| 2020's | -22,039 | 37,767 | 35,531 | -99,120 |
| - = No Data Reported; -- = Not Applicable; NA = Not Available; W = Withheld to avoid disclosure of individual company data. |
| Release Date: 3/29/2024 |
| Next Release Date: 4/30/2024 |