|
Download Data (XLS File) |
|
||||||||
|
||||||||
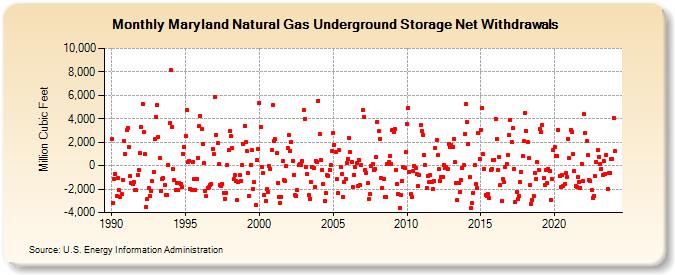
| Maryland Natural Gas Underground Storage Net Withdrawals (Million Cubic Feet) | ||||||||
| Year | Jan | Feb | Mar | Apr | May | Jun | Jul | Aug | Sep | Oct | Nov | Dec |
|---|---|---|---|---|---|---|---|---|---|---|---|---|
| 1990 | 2,250 | -3,160 | -1,104 | -732 | -2,557 | -1,057 | -2,100 | -2,660 | -2,435 | -1,237 | 2,125 | 991 |
| 1991 | 3,005 | 3,196 | 1,559 | -903 | -1,520 | -1,590 | -1,392 | -2,061 | -2,084 | -800 | -334 | 1,070 |
| 1992 | 3,314 | 5,269 | 2,840 | 958 | -3,527 | -2,867 | -1,942 | -2,546 | -2,204 | -1,333 | -544 | 2,249 |
| 1993 | 4,189 | 5,170 | 2,455 | 613 | -2,168 | -1,119 | -1,074 | -1,646 | -2,502 | -2,521 | 78 | 3,633 |
| 1994 | 8,120 | 3,305 | -290 | -1,256 | -2,046 | -1,459 | -2,113 | -1,468 | -1,536 | -1,781 | 1,016 | 1,597 |
| 1995 | 2,547 | 4,767 | 279 | 415 | -2,010 | -2,042 | 332 | -1,114 | -2,041 | -1,123 | 689 | 3,350 |
| 1996 | 4,254 | 3,086 | 1,827 | 212 | -2,154 | -2,621 | -1,887 | -1,845 | -1,677 | -1,553 | 1,424 | 958 |
| 1997 | 5,867 | 2,653 | 1,896 | 114 | -1,632 | -1,700 | -1,536 | -2,353 | -2,838 | -2,346 | 33 | 1,298 |
| 1998 | 2,951 | 2,507 | 1,464 | -1,138 | -816 | -1,266 | -2,954 | -1,413 | -809 | -1,312 | 29 | 1,882 |
| 1999 | 3,403 | 1,984 | 1,210 | -666 | -2,551 | 93 | 1,324 | -1,953 | -1,411 | -3,376 | 460 | 1,420 |
| 2000 | 5,382 | 3,312 | -83 | -652 | -2,478 | -2,994 | -2,005 | -2,241 | -44 | -288 | 1,323 | 5,151 |
| 2001 | 2,106 | 2,236 | 1,073 | -1,468 | -2,714 | -3,170 | -2,644 | 409 | -1,221 | -1,349 | -71 | 1,508 |
| 2002 | 2,642 | 1,289 | 2,041 | 403 | -780 | -2,505 | -2,619 | -2,105 | 33 | 124 | 55 | 364 |
| 2003 | 4,738 | 4,003 | -124 | -750 | -2,534 | -2,816 | -1,363 | -110 | -160 | -1,815 | 421 | 286 |
| 2004 | 5,535 | 2,661 | 523 | -337 | -1,535 | -3,040 | -2,357 | -823 | -900 | -338 | 41 | 1,261 |
| 2005 | 2,766 | 1,803 | 1,158 | -1,127 | -2,342 | 1,334 | -77 | -670 | -2,653 | -1,354 | -1,131 | 257 |
| 2006 | 584 | 2,378 | 1,148 | 344 | -1,797 | -797 | -131 | 221 | -1,732 | 486 | -1,659 | 17 |
| 2007 | 4,715 | 4,162 | -403 | -601 | -1,491 | -2,818 | -2,421 | -31 | 165 | -349 | -286 | 770 |
| 2008 | 3,725 | 2,969 | 2,276 | -1,086 | -1,905 | -1,156 | -2,691 | -2,663 | 176 | 295 | 809 | 179 |
| 2009 | 3,034 | 2,893 | 3,134 | -359 | -1,563 | -2,399 | -3,573 | -2,490 | -1,297 | -85 | -184 | 1,131 |
| 2010 | 3,515 | 4,930 | -499 | -2,423 | -2,681 | -493 | -28 | -172 | -738 | -1,758 | -801 | 3,439 |
| 2011 | 2,990 | 2,605 | 869 | 20 | -1,877 | -907 | -1,420 | -818 | -1,392 | -1,977 | -1,313 | 1,499 |
| 2012 | 2,225 | 898 | -306 | -1,302 | -958 | -966 | 24 | -224 | -121 | -317 | 1,875 | 1,554 |
| 2013 | 1,787 | 1,600 | 2,279 | 285 | -1,486 | -2,932 | -1,459 | -2,254 | -1,190 | -190 | 18 | 2,732 |
| 2014 | 5,240 | 3,686 | 1,843 | -979 | -3,611 | -3,179 | -2,308 | 14 | -1,591 | -1,919 | 2,764 | 596 |
| 2015 | 3,057 | 4,876 | 970 | -254 | -2,522 | -2,577 | -2,440 | -2,786 | -372 | -262 | 490 | 517 |
| 2016 | 3,991 | 2,294 | -342 | 716 | -1,671 | -3,022 | -1,133 | -1,397 | -150 | 133 | 893 | 2,604 |
| 2017 | 3,915 | 2,048 | 3,170 | -280 | -3,128 | -2,241 | -2,873 | -2,626 | -1,395 | -533 | 816 | 2,079 |
| 2018 | 4,492 | 2,961 | 1,983 | 654 | -1,661 | -3,246 | -2,904 | -2,598 | -652 | -1,099 | 288 | -346 |
| 2019 | 3,137 | 2,834 | 3,480 | -1,044 | -1,647 | -395 | -1,498 | -247 | -429 | -2,900 | -1,145 | 1,369 |
| 2020 | 1,610 | 836 | 789 | 3,082 | -868 | -1,845 | -777 | -1,761 | -1,600 | -623 | -968 | 2,284 |
| 2021 | 639 | 3,063 | 2,909 | 961 | -497 | -1,775 | -1,787 | -937 | -1,370 | -1,873 | 181 | -1,317 |
| 2022 | 4,398 | 2,803 | 2,099 | 867 | -1,231 | -1,302 | -2,057 | -2,716 | -2,574 | -896 | 303 | 1,330 |
| 2023 | 773 | 178 | -260 | -835 | 429 | -694 | 924 | -1,962 | -616 | -593 | 588 | 598 |
| 2024 | 4,068 | |||||||||||
| - = No Data Reported; -- = Not Applicable; NA = Not Available; W = Withheld to avoid disclosure of individual company data. |
| Release Date: 3/29/2024 |
| Next Release Date: 4/30/2024 |