|
Download Data (XLS File) |
|
||||||||
|
||||||||
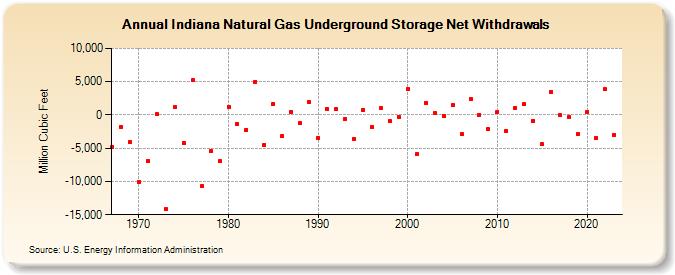
| Indiana Natural Gas Underground Storage Net Withdrawals (Million Cubic Feet) | ||||||||
| Decade | Year-0 | Year-1 | Year-2 | Year-3 | Year-4 | Year-5 | Year-6 | Year-7 | Year-8 | Year-9 |
|---|---|---|---|---|---|---|---|---|---|---|
| 1960's | -4,791 | -1,773 | -4,098 | |||||||
| 1970's | -10,025 | -6,877 | 76 | -14,151 | 1,218 | -4,219 | 5,176 | -10,709 | -5,425 | -6,982 |
| 1980's | 1,264 | -1,352 | -2,205 | 5,005 | -4,472 | 1,652 | -3,137 | 473 | -1,224 | 1,884 |
| 1990's | -3,410 | 926 | 840 | -596 | -3,576 | 711 | -1,801 | 984 | -921 | -244 |
| 2000's | 3,892 | -5,910 | 1,840 | 261 | -199 | 1,422 | -2,891 | 2,419 | 37 | -2,181 |
| 2010's | 511 | -2,401 | 1,097 | 1,591 | -841 | -4,411 | 3,478 | -69 | -279 | -2,817 |
| 2020's | 506 | -3,471 | 3,865 | -2,948 |
| - = No Data Reported; -- = Not Applicable; NA = Not Available; W = Withheld to avoid disclosure of individual company data. |
| Release Date: 3/29/2024 |
| Next Release Date: 4/30/2024 |