|
Download Data (XLS File) |
|
||||||||
|
||||||||
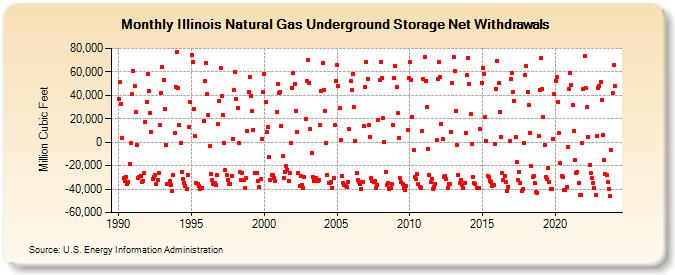
| Illinois Natural Gas Underground Storage Net Withdrawals (Million Cubic Feet) | ||||||||
| Year | Jan | Feb | Mar | Apr | May | Jun | Jul | Aug | Sep | Oct | Nov | Dec |
|---|---|---|---|---|---|---|---|---|---|---|---|---|
| 1990 | 36,920 | 51,120 | 32,950 | 3,696 | -30,874 | -32,757 | -29,394 | -35,504 | -33,537 | -18,692 | -594 | 40,741 |
| 1991 | 60,973 | 48,068 | 25,373 | -2,559 | -30,660 | -29,798 | -28,745 | -34,057 | -32,897 | -26,390 | 17,558 | 34,113 |
| 1992 | 58,118 | 43,448 | 25,247 | 8,578 | -31,163 | -29,861 | -28,140 | -35,313 | -32,462 | -26,155 | 14,263 | 42,048 |
| 1993 | 63,751 | 53,114 | 28,317 | -2,013 | -35,988 | -35,244 | -33,084 | -36,393 | -41,424 | -27,980 | 7,677 | 47,074 |
| 1994 | 76,867 | 46,395 | 14,791 | -502 | -25,727 | -31,224 | -34,981 | -37,123 | -40,132 | -27,773 | 12,634 | 33,868 |
| 1995 | 74,603 | 68,672 | 28,695 | 5,540 | -34,672 | -35,273 | -37,156 | -39,596 | -39,267 | -38,814 | 18,278 | 51,971 |
| 1996 | 67,753 | 40,993 | 22,829 | -3,200 | -26,711 | -32,122 | -35,480 | -35,172 | -36,529 | -28,103 | 15,523 | 35,109 |
| 1997 | 63,269 | 39,383 | 22,821 | -636 | -23,526 | -27,571 | -32,161 | -35,387 | -35,655 | -28,399 | 2,805 | 44,906 |
| 1998 | 59,692 | 37,109 | 28,954 | -559 | -25,812 | -32,534 | -25,975 | -32,631 | -39,382 | -30,361 | 9,311 | 42,407 |
| 1999 | 55,871 | 39,761 | 26,392 | 10,812 | -25,941 | -25,952 | -25,990 | -32,748 | -38,163 | -31,518 | 2,345 | 42,415 |
| 2000 | 58,269 | 34,034 | 8,699 | 13,169 | -12,923 | -32,238 | -27,774 | -27,776 | -30,571 | -33,495 | 25,535 | 49,235 |
| 2001 | 42,128 | 43,197 | 14,166 | -12,124 | -30,499 | -25,516 | -20,310 | -23,439 | -33,020 | -25,879 | -726 | 46,435 |
| 2002 | 58,718 | 49,782 | 26,800 | 8,617 | -26,088 | -37,540 | -28,544 | -36,473 | -38,648 | -29,718 | 19,615 | 52,510 |
| 2003 | 70,407 | 50,338 | 11,028 | -8,980 | -29,399 | -32,674 | -32,362 | -30,265 | -33,079 | -32,129 | 14,742 | 43,473 |
| 2004 | 67,571 | 44,777 | 26,768 | -750 | -27,588 | -34,451 | -34,646 | -34,089 | -38,974 | -30,615 | 14,552 | 52,049 |
| 2005 | 65,878 | 47,565 | 29,033 | 1,745 | -28,986 | -34,509 | -36,120 | -37,164 | -38,438 | -33,782 | 11,186 | 52,366 |
| 2006 | 44,792 | 58,397 | 30,352 | 1,281 | -26,254 | -32,599 | -33,696 | -35,795 | -39,774 | -34,007 | 13,461 | 46,678 |
| 2007 | 68,301 | 54,277 | 14,660 | 4,716 | -30,392 | -32,789 | -34,214 | -33,438 | -39,181 | -36,610 | 19,042 | 52,960 |
| 2008 | 68,017 | 54,417 | 20,499 | 3 | -25,611 | -36,126 | -34,743 | -40,321 | -39,464 | -36,054 | 14,302 | 54,575 |
| 2009 | 65,060 | 46,821 | 25,030 | 3,628 | -30,860 | -33,808 | -35,495 | -39,125 | -40,911 | -37,052 | 10,313 | 54,935 |
| 2010 | 68,075 | 53,029 | 21,363 | -7,071 | -30,014 | -31,297 | -27,354 | -35,682 | -38,164 | -38,847 | 9,533 | 54,106 |
| 2011 | 72,555 | 52,470 | 30,053 | -5,552 | -27,948 | -33,549 | -31,333 | -40,046 | -38,580 | -35,363 | 2,195 | 53,914 |
| 2012 | 68,015 | 55,400 | 15,641 | 2,589 | -29,462 | -29,239 | -31,211 | -38,847 | -35,293 | -35,976 | 8,869 | 50,515 |
| 2013 | 72,686 | 60,736 | 26,339 | -2,759 | -27,868 | -34,613 | -32,123 | -36,406 | -38,902 | -34,674 | 7,962 | 56,945 |
| 2014 | 72,190 | 49,721 | 23,881 | -1,578 | -29,654 | -35,170 | -35,418 | -39,186 | -38,887 | -38,767 | 11,226 | 50,911 |
| 2015 | 63,529 | 58,104 | 21,193 | 1,105 | -28,714 | -29,520 | -32,685 | -34,172 | -37,238 | -36,756 | -1,164 | 45,715 |
| 2016 | 69,604 | 50,274 | 26,092 | 4,551 | -26,284 | -32,072 | -28,440 | -33,535 | -41,363 | -37,807 | 623 | 53,639 |
| 2017 | 59,371 | 42,917 | 35,264 | 4,438 | -17,012 | -32,389 | -25,184 | -34,888 | -41,306 | -40,165 | -333 | 57,696 |
| 2018 | 64,676 | 43,006 | 31,354 | 7,769 | -20,286 | -29,674 | -28,754 | -34,744 | -42,720 | -43,390 | 5,019 | 44,338 |
| 2019 | 71,746 | 44,951 | 21,726 | -2,460 | -29,250 | -31,465 | -21,798 | -34,114 | -39,814 | -39,931 | 2,466 | 40,690 |
| 2020 | 52,539 | 55,297 | 34,667 | 7,597 | -18,009 | -28,451 | -29,436 | -40,365 | -40,475 | -38,409 | -4,152 | 45,251 |
| 2021 | 59,429 | 48,591 | 31,440 | 9,718 | -14,991 | -26,141 | -25,250 | -34,957 | -45,164 | -44,771 | -867 | 45,324 |
| 2022 | 73,361 | 46,075 | 30,379 | 4,813 | -19,121 | -26,677 | -30,481 | -34,626 | -38,908 | -45,403 | 4,926 | 46,078 |
| 2023 | 47,923 | 51,258 | 36,124 | 6,481 | -15,376 | -27,140 | -28,118 | -33,745 | -39,880 | -46,091 | -7,035 | 41,607 |
| 2024 | 65,597 | |||||||||||
| - = No Data Reported; -- = Not Applicable; NA = Not Available; W = Withheld to avoid disclosure of individual company data. |
| Release Date: 3/29/2024 |
| Next Release Date: 4/30/2024 |