|
Download Data (XLS File) |
|
||||||||
|
||||||||
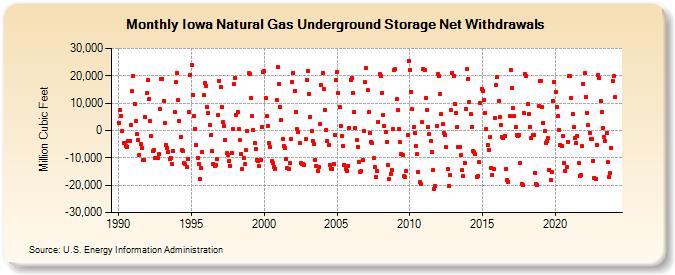
| Iowa Natural Gas Underground Storage Net Withdrawals (Million Cubic Feet) | ||||||||
| Year | Jan | Feb | Mar | Apr | May | Jun | Jul | Aug | Sep | Oct | Nov | Dec |
|---|---|---|---|---|---|---|---|---|---|---|---|---|
| 1990 | 2,832 | 7,609 | 5,181 | -148 | -4,486 | -4,736 | -5,657 | -5,928 | -3,720 | -3,912 | 1,953 | 14,310 |
| 1991 | 20,045 | 9,791 | 3,415 | -1,298 | -3,536 | -8,983 | -5,100 | -6,433 | -10,675 | -10,757 | 4,997 | 13,739 |
| 1992 | 18,442 | 11,535 | 3,325 | -2,061 | -7,583 | -7,264 | -10,141 | -10,162 | -10,088 | -8,683 | 7,997 | 18,942 |
| 1993 | 18,991 | 10,808 | 2,692 | -5,197 | -6,482 | -7,776 | -10,550 | -10,142 | -12,351 | -7,471 | 6,652 | 17,647 |
| 1994 | 21,064 | 11,173 | 3,361 | -2,548 | -7,152 | -7,623 | -11,997 | -12,403 | -13,446 | -10,323 | 6,758 | 20,371 |
| 1995 | 24,012 | 12,947 | 5,332 | 643 | -5,203 | -9,889 | -12,204 | -17,800 | -13,599 | -7,844 | 12,827 | 17,220 |
| 1996 | 16,282 | 8,653 | 6,303 | 1,980 | -1,640 | -7,677 | -12,393 | -13,166 | -12,536 | -10,555 | 5,502 | 18,020 |
| 1997 | 16,003 | 8,497 | 2,966 | 1,634 | -3,470 | -8,375 | -8,818 | -11,001 | -12,825 | -8,412 | 505 | 17,041 |
| 1998 | 19,310 | 5,558 | 6,794 | 387 | -3,579 | -8,440 | -14,097 | -10,097 | -12,282 | -7,251 | -178 | 20,920 |
| 1999 | 20,553 | 11,814 | 5,170 | 86 | -4,596 | -6,837 | -10,783 | -11,316 | -13,108 | -10,941 | 1,096 | 21,305 |
| 2000 | 21,684 | 11,692 | 5,353 | 1,749 | -4,620 | -6,094 | -11,254 | -12,021 | -13,240 | -13,898 | 11,086 | 23,122 |
| 2001 | 16,843 | 8,401 | 3,819 | -3,039 | -5,752 | -6,250 | -10,345 | -13,804 | -13,993 | -11,915 | -3,054 | 17,655 |
| 2002 | 20,958 | 14,545 | 6,882 | 400 | -630 | -4,696 | -11,781 | -12,098 | -12,188 | -12,503 | -3,249 | 18,612 |
| 2003 | 21,778 | 13,459 | 4,895 | -80 | -3,694 | -5,103 | -10,709 | -12,884 | -14,850 | -13,224 | 2,186 | 16,451 |
| 2004 | 21,055 | 15,287 | 7,423 | 333 | -3,980 | -5,414 | -12,598 | -13,985 | -13,986 | -12,414 | -1,668 | 18,281 |
| 2005 | 21,401 | 13,730 | 8,642 | 1,649 | -1,840 | -5,739 | -12,494 | -14,039 | -14,746 | -12,821 | 1,009 | 18,627 |
| 2006 | 19,256 | 13,681 | 6,578 | 1,064 | -3,562 | -5,918 | -11,377 | -15,048 | -14,841 | -10,970 | -49 | 17,622 |
| 2007 | 22,654 | 14,626 | 6,649 | -797 | -4,076 | -4,703 | -10,220 | -13,521 | -16,930 | -14,935 | 3,114 | 20,590 |
| 2008 | 20,004 | 13,671 | 5,594 | 1,522 | -448 | -4,146 | -12,800 | -17,699 | -15,965 | -14,478 | 466 | 22,004 |
| 2009 | 22,486 | 11,432 | 7,448 | 434 | -4,213 | -8,479 | -9,143 | -16,804 | -16,845 | -14,794 | -1,811 | 25,428 |
| 2010 | 22,127 | 14,219 | 7,720 | 1,131 | -906 | -5,629 | -8,614 | -15,024 | -18,866 | -19,552 | 2,933 | 22,501 |
| 2011 | 22,133 | 11,918 | 7,337 | 1,413 | -1,357 | -3,867 | -7,910 | -14,478 | -21,307 | -20,243 | 1,519 | 20,598 |
| 2012 | 19,957 | 13,435 | 5,999 | 2,196 | -906 | -1,777 | -6,049 | -14,247 | -20,259 | -16,348 | 7,358 | 21,157 |
| 2013 | 19,790 | 9,689 | 6,244 | 1,427 | -6,081 | -6,072 | -9,085 | -14,568 | -16,681 | -11,825 | 7,889 | 22,346 |
| 2014 | 18,955 | 10,432 | 5,913 | 1,171 | -7,521 | -7,981 | -8,737 | -16,826 | -16,589 | -11,564 | 9,991 | 15,333 |
| 2015 | 14,550 | 11,129 | 6,384 | 541 | -5,355 | -6,962 | -2,563 | -13,614 | -16,136 | -14,124 | 4,637 | 16,556 |
| 2016 | 19,427 | 10,674 | 4,762 | 2,150 | -2,349 | -2,856 | -1,925 | -14,078 | -18,041 | -18,715 | 5,150 | 22,217 |
| 2017 | 15,571 | 8,052 | 5,165 | 1,288 | -1,579 | -1,917 | -1,696 | -11,805 | -19,446 | -20,082 | 6,240 | 20,539 |
| 2018 | 19,932 | 9,545 | 6,081 | 1,387 | -2,828 | -1,593 | -1,673 | -15,538 | -19,504 | -19,964 | 8,860 | 18,169 |
| 2019 | 18,111 | 8,451 | 2,664 | -332 | -4,426 | -3,932 | -2,823 | -14,316 | -18,004 | -15,128 | 10,941 | 17,729 |
| 2020 | 14,066 | 8,457 | 5,299 | 233 | -5,357 | -5,646 | -1,925 | -11,918 | -14,935 | -13,421 | -4,156 | 19,832 |
| 2021 | 19,762 | 12,008 | 6,088 | 1,135 | -2,814 | -4,478 | -2,086 | -11,895 | -16,482 | -16,454 | -5,856 | 17,132 |
| 2022 | 20,920 | 12,336 | 6,555 | 1,911 | -777 | -3,110 | -3,052 | -11,183 | -17,235 | -17,640 | -5,160 | 20,131 |
| 2023 | 19,307 | 10,810 | 6,790 | 938 | -2,360 | -4,012 | -843 | -11,625 | -16,991 | -15,628 | -6,298 | 17,950 |
| 2024 | 19,788 | 12,210 | ||||||||||
| - = No Data Reported; -- = Not Applicable; NA = Not Available; W = Withheld to avoid disclosure of individual company data. |
| Release Date: 4/30/2024 |
| Next Release Date: 5/31/2024 |