|
Download Data (XLS File) |
|
||||||||
|
||||||||
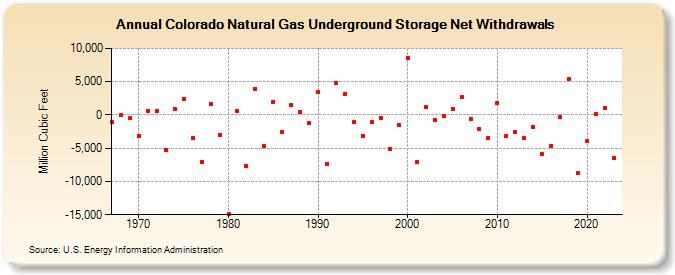
| Colorado Natural Gas Underground Storage Net Withdrawals (Million Cubic Feet) | ||||||||
| Decade | Year-0 | Year-1 | Year-2 | Year-3 | Year-4 | Year-5 | Year-6 | Year-7 | Year-8 | Year-9 |
|---|---|---|---|---|---|---|---|---|---|---|
| 1960's | -1,134 | 1 | -535 | |||||||
| 1970's | -3,127 | 594 | 522 | -5,290 | 910 | 2,465 | -3,531 | -7,027 | 1,663 | -3,006 |
| 1980's | -14,819 | 641 | -7,663 | 3,927 | -4,697 | 1,989 | -2,570 | 1,518 | 481 | -1,223 |
| 1990's | 3,500 | -7,370 | 4,860 | 3,162 | -1,100 | -3,152 | -1,004 | -525 | -5,072 | -1,502 |
| 2000's | 8,613 | -7,080 | 1,141 | -759 | -149 | 854 | 2,670 | -633 | -2,140 | -3,442 |
| 2010's | 1,760 | -3,128 | -2,570 | -3,404 | -1,818 | -5,930 | -4,606 | -309 | 5,422 | -8,796 |
| 2020's | -3,981 | 73 | 1,105 | -6,465 |
| - = No Data Reported; -- = Not Applicable; NA = Not Available; W = Withheld to avoid disclosure of individual company data. |
| Release Date: 3/29/2024 |
| Next Release Date: 4/30/2024 |