|
Download Data (XLS File) |
|
||||||||
|
||||||||
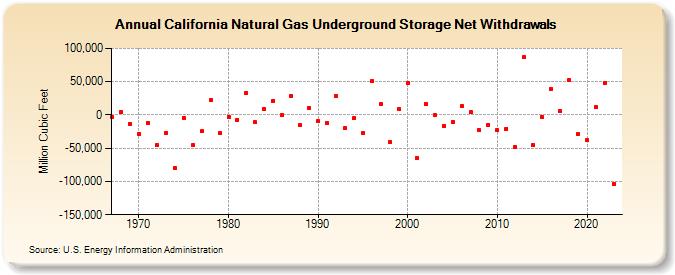
| California Natural Gas Underground Storage Net Withdrawals (Million Cubic Feet) | ||||||||
| Decade | Year-0 | Year-1 | Year-2 | Year-3 | Year-4 | Year-5 | Year-6 | Year-7 | Year-8 | Year-9 |
|---|---|---|---|---|---|---|---|---|---|---|
| 1960's | -3,204 | 4,546 | -13,027 | |||||||
| 1970's | -28,025 | -11,624 | -45,671 | -26,815 | -79,534 | -4,066 | -45,264 | -24,912 | 23,019 | -27,375 |
| 1980's | -2,686 | -7,183 | 32,738 | -11,267 | 8,542 | 21,393 | -364 | 28,692 | -15,792 | 10,554 |
| 1990's | -9,322 | -12,276 | 28,120 | -19,693 | -5,066 | -27,358 | 51,292 | 16,340 | -40,969 | 8,194 |
| 2000's | 47,960 | -64,674 | 17,023 | -712 | -16,333 | -10,696 | 13,290 | 3,687 | -22,721 | -14,565 |
| 2010's | -23,157 | -20,591 | -48,077 | 86,502 | -45,335 | -2,698 | 39,603 | 5,688 | 52,175 | -28,135 |
| 2020's | -38,314 | 11,885 | 48,440 | -103,170 |
| - = No Data Reported; -- = Not Applicable; NA = Not Available; W = Withheld to avoid disclosure of individual company data. |
| Release Date: 3/29/2024 |
| Next Release Date: 4/30/2024 |