|
Download Data (XLS File) |
|
||||||||
|
||||||||
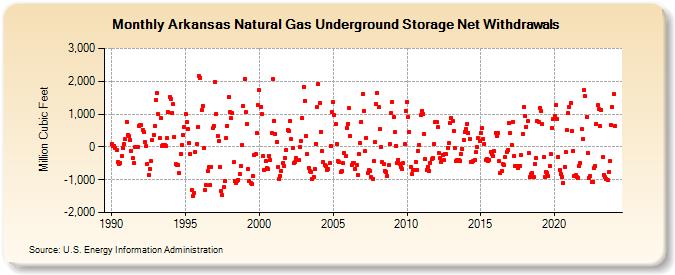
| Arkansas Natural Gas Underground Storage Net Withdrawals (Million Cubic Feet) | ||||||||
| Year | Jan | Feb | Mar | Apr | May | Jun | Jul | Aug | Sep | Oct | Nov | Dec |
|---|---|---|---|---|---|---|---|---|---|---|---|---|
| 1990 | 84 | 31 | 38 | -36 | -100 | -473 | -527 | -481 | -279 | -28 | 79 | 227 |
| 1991 | 762 | 366 | 321 | 195 | -131 | -339 | -487 | -14 | 0 | 0 | 629 | 664 |
| 1992 | 652 | 519 | 443 | 159 | 16 | -509 | -852 | -664 | -434 | 196 | 366 | 624 |
| 1993 | 1,428 | 1,638 | 991 | 259 | 865 | 36 | 56 | 61 | 35 | 262 | 1,055 | 1,520 |
| 1994 | 1,468 | 1,041 | 1,303 | 310 | -531 | -553 | -563 | -803 | -210 | 64 | 359 | 597 |
| 1995 | 1,005 | 753 | 539 | 130 | -211 | -1,312 | -1,494 | -1,390 | -157 | 80 | 618 | 2,149 |
| 1996 | 2,112 | 1,115 | 1,259 | -44 | -1,302 | -1,166 | -744 | -615 | -1,153 | -603 | 562 | 644 |
| 1997 | 1,978 | 1,006 | 342 | 178 | -608 | -1,340 | -1,472 | -1,234 | -1,048 | 271 | 651 | 1,526 |
| 1998 | 1,057 | 875 | 1,039 | -471 | -1,046 | -1,100 | -1,034 | -1,005 | -817 | -580 | 63 | 1,245 |
| 1999 | 2,066 | 1,049 | 690 | -667 | -1,045 | -1,086 | -1,116 | -901 | -237 | -219 | 423 | 1,276 |
| 2000 | 1,722 | 1,228 | 997 | -287 | -698 | -444 | -649 | -680 | -268 | -397 | 432 | 2,077 |
| 2001 | 795 | 397 | 143 | -603 | -992 | -879 | -740 | -505 | -579 | -338 | -87 | 513 |
| 2002 | 491 | 776 | 239 | -46 | -504 | -463 | -340 | -390 | -393 | -17 | 167 | 877 |
| 2003 | 1,836 | 1,409 | 341 | -209 | -632 | -741 | -752 | -977 | -907 | -679 | 97 | 1,212 |
| 2004 | 1,912 | 1,331 | 455 | -136 | -465 | -548 | -590 | -695 | -668 | -493 | 35 | 1,049 |
| 2005 | 1,359 | 960 | 688 | 92 | -435 | -474 | -776 | -739 | -501 | -175 | -264 | 579 |
| 2006 | 712 | 1,171 | 329 | -544 | -496 | -499 | -672 | -539 | -841 | -226 | 124 | 773 |
| 2007 | 1,609 | 1,095 | -139 | 280 | -793 | -713 | -723 | -930 | -969 | -443 | 152 | 1,296 |
| 2008 | 1,646 | 1,212 | 550 | 5 | -469 | -530 | -737 | -763 | -895 | -562 | 82 | 1,025 |
| 2009 | 1,371 | 908 | 442 | 39 | -498 | -384 | -523 | -608 | -665 | -499 | 74 | 1,103 |
| 2010 | 1,379 | 920 | 466 | -598 | -828 | -715 | -696 | -445 | -692 | -119 | 66 | 957 |
| 2011 | 1,108 | 1,006 | 403 | -380 | -690 | -598 | -726 | -477 | -380 | -339 | 99 | 755 |
| 2012 | 758 | 602 | -180 | -334 | -460 | -239 | -404 | -221 | -230 | -22 | 106 | 734 |
| 2013 | 868 | 782 | 496 | -28 | -442 | -402 | -406 | -433 | -204 | -50 | 218 | 453 |
| 2014 | 546 | 707 | 416 | 248 | -450 | -450 | -422 | -396 | -166 | -12 | 259 | 187 |
| 2015 | 431 | 567 | 234 | 91 | -411 | -357 | -437 | -403 | -141 | -212 | -283 | -127 |
| 2016 | 434 | 328 | 438 | -444 | -801 | -724 | -517 | -564 | -318 | -152 | -86 | 739 |
| 2017 | 418 | 66 | 772 | -272 | -595 | -581 | -647 | -574 | -582 | -251 | 397 | 1,220 |
| 2018 | 951 | 616 | 776 | -193 | -917 | -838 | -793 | -931 | -522 | -345 | 779 | 763 |
| 2019 | 1,185 | 1,094 | 696 | -312 | -903 | -768 | -798 | -886 | -583 | -231 | 578 | 861 |
| 2020 | 935 | 1,273 | 853 | -307 | -715 | -823 | -914 | -1,102 | -599 | -162 | 505 | 1,019 |
| 2021 | 1,208 | 1,352 | 480 | -128 | -879 | -865 | -902 | -936 | -581 | -485 | 535 | 241 |
| 2022 | 1,726 | 1,541 | 899 | -177 | -947 | -882 | -1,074 | -1,067 | -629 | -588 | 708 | 1,265 |
| 2023 | 1,157 | 627 | 1,129 | -319 | -846 | -929 | -964 | -1,006 | -764 | -441 | 660 | 1,217 |
| 2024 | 1,621 | 648 | ||||||||||
| - = No Data Reported; -- = Not Applicable; NA = Not Available; W = Withheld to avoid disclosure of individual company data. |
| Release Date: 4/30/2024 |
| Next Release Date: 5/31/2024 |