|
Download Data (XLS File) |
|
||||||||
|
||||||||
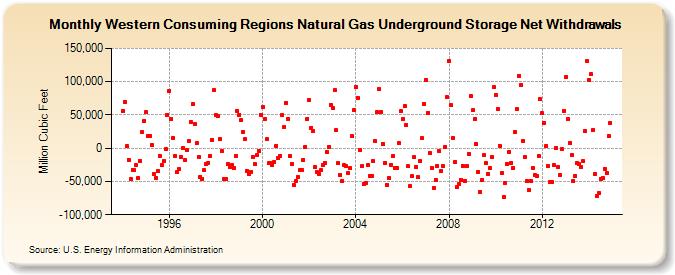
| Western Consuming Regions Natural Gas Underground Storage Net Withdrawals (Million Cubic Feet) | ||||||||
| Year | Jan | Feb | Mar | Apr | May | Jun | Jul | Aug | Sep | Oct | Nov | Dec |
|---|---|---|---|---|---|---|---|---|---|---|---|---|
| 1994 | 56,431 | 69,927 | 3,052 | -17,211 | -45,978 | -32,279 | -32,989 | -25,334 | -44,879 | -18,799 | 23,717 | 41,318 |
| 1995 | 53,772 | 18,375 | 19,016 | 5,109 | -38,707 | -45,134 | -34,084 | -11,010 | -25,651 | -19,848 | -1,356 | 50,466 |
| 1996 | 86,501 | 43,928 | 15,252 | -11,149 | -36,431 | -31,788 | -13,101 | 874 | -17,907 | -3,217 | 10,566 | 39,316 |
| 1997 | 66,259 | 37,049 | 7,088 | -13,297 | -42,743 | -45,825 | -33,161 | -23,050 | -21,826 | -11,630 | 12,560 | 87,001 |
| 1998 | 49,259 | 48,858 | 13,435 | -4,634 | -46,550 | -45,804 | -23,795 | -28,194 | -25,888 | -30,145 | -12,444 | 55,973 |
| 1999 | 50,539 | 41,943 | 24,411 | 13,246 | -34,017 | -39,197 | -35,399 | -12,599 | -24,100 | -10,388 | -3,678 | 49,889 |
| 2000 | 61,240 | 43,345 | 13,411 | -22,936 | -21,890 | -24,998 | -20,100 | 3,374 | -14,602 | -11,083 | 50,522 | 31,251 |
| 2001 | 68,034 | 43,934 | -12,224 | -23,869 | -55,061 | -49,075 | -43,346 | -33,334 | -33,154 | -17,133 | 2,376 | 44,308 |
| 2002 | 72,123 | 31,061 | 25,125 | -28,937 | -35,831 | -38,144 | -33,193 | -25,673 | -22,009 | -5,696 | 1,786 | 65,450 |
| 2003 | 60,043 | 86,900 | 26,859 | -21,920 | -39,908 | -49,383 | -25,547 | -27,376 | -37,667 | -30,524 | 17,915 | 57,513 |
| 2004 | 92,320 | 75,264 | -3,007 | -27,393 | -53,144 | -52,197 | -26,007 | -41,545 | -42,341 | -19,955 | 10,290 | 54,304 |
| 2005 | 88,804 | 53,977 | 6,824 | -22,271 | -54,758 | -44,843 | -24,559 | -12,235 | -30,078 | -29,968 | 7,661 | 55,395 |
| 2006 | 43,774 | 62,760 | 34,921 | -27,166 | -57,184 | -42,396 | -13,932 | -27,861 | -43,961 | -20,012 | 14,617 | 66,504 |
| 2007 | 102,549 | 53,612 | -7,550 | -30,141 | -59,651 | -47,311 | -26,500 | -4,881 | -33,818 | -27,277 | 2,012 | 76,826 |
| 2008 | 130,321 | 64,715 | 14,990 | -20,699 | -58,481 | -53,874 | -47,634 | -26,378 | -48,816 | -27,250 | -8,848 | 78,223 |
| 2009 | 56,735 | 43,892 | 6,385 | -35,588 | -65,616 | -47,435 | -10,852 | -22,349 | -38,216 | -30,452 | -13,275 | 91,351 |
| 2010 | 79,946 | 58,644 | 3,587 | -37,615 | -73,150 | -51,995 | -24,485 | -5,593 | -21,970 | -29,529 | 24,854 | 58,174 |
| 2011 | 109,040 | 95,168 | 10,929 | -13,257 | -49,923 | -62,531 | -48,690 | -29,054 | -40,233 | -41,776 | -11,430 | 73,221 |
| 2012 | 52,444 | 37,862 | 3,517 | -27,043 | -50,487 | -51,417 | -25,824 | 620 | -28,758 | -40,356 | -1,083 | 56,291 |
| 2013 | 106,631 | 43,693 | 7,915 | -10,186 | -48,609 | -41,316 | -22,483 | -24,302 | -28,300 | -19,704 | 25,468 | 130,446 |
| 2014 | 102,756 | 110,986 | 27,039 | -38,327 | -71,567 | -67,673 | -46,047 | -45,346 | -30,762 | -37,930 | 18,467 | 38,394 |
| - = No Data Reported; -- = Not Applicable; NA = Not Available; W = Withheld to avoid disclosure of individual company data. |
| Release Date: 3/29/2024 |
| Next Release Date: 4/30/2024 |