|
Download Data (XLS File) |
|
||||||||
|
||||||||
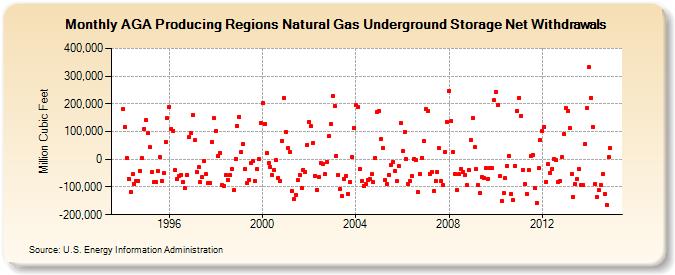
| AGA Producing Regions Natural Gas Underground Storage Net Withdrawals (Million Cubic Feet) | ||||||||
| Year | Jan | Feb | Mar | Apr | May | Jun | Jul | Aug | Sep | Oct | Nov | Dec |
|---|---|---|---|---|---|---|---|---|---|---|---|---|
| 1994 | 181,202 | 117,919 | 6,043 | -70,389 | -119,495 | -54,764 | -90,630 | -78,703 | -78,810 | -41,384 | 3,174 | 110,677 |
| 1995 | 141,597 | 94,129 | 43,122 | -46,127 | -83,740 | -81,214 | -42,329 | 7,753 | -77,793 | -50,909 | 62,552 | 147,261 |
| 1996 | 189,543 | 108,720 | 103,253 | -39,312 | -70,578 | -61,809 | -55,791 | -81,685 | -105,390 | -57,617 | 79,056 | 94,165 |
| 1997 | 159,274 | 68,321 | -45,732 | -28,852 | -82,922 | -65,620 | -5,729 | -52,520 | -86,054 | -85,240 | 63,672 | 147,412 |
| 1998 | 101,163 | 10,342 | 23,740 | -93,466 | -97,929 | -57,723 | -73,822 | -57,671 | -36,017 | -111,305 | 2,052 | 120,522 |
| 1999 | 153,986 | 27,076 | 55,017 | -35,949 | -87,235 | -74,047 | -14,239 | -6,737 | -77,700 | -35,924 | 515 | 132,062 |
| 2000 | 201,606 | 127,455 | 21,465 | -13,293 | -27,098 | -58,272 | -39,442 | -4,324 | -66,987 | -78,226 | 66,960 | 220,332 |
| 2001 | 97,761 | 39,606 | 26,592 | -113,709 | -143,503 | -128,023 | -75,749 | -56,394 | -104,882 | -37,173 | -46,629 | 52,233 |
| 2002 | 133,729 | 118,245 | 60,050 | -59,236 | -109,513 | -65,157 | -14,376 | -15,825 | -54,494 | -8,235 | 82,734 | 128,493 |
| 2003 | 229,393 | 191,320 | 13,598 | -56,470 | -107,616 | -132,665 | -71,840 | -58,975 | -125,219 | -83,494 | 7,382 | 113,086 |
| 2004 | 194,635 | 188,578 | -33,815 | -78,313 | -96,590 | -88,502 | -73,031 | -72,065 | -54,447 | -83,029 | 5,964 | 171,868 |
| 2005 | 174,360 | 73,872 | 39,808 | -75,007 | -90,863 | -56,983 | -20,444 | -9,503 | -40,867 | -79,494 | -26,003 | 129,692 |
| 2006 | 28,324 | 97,636 | 466 | -87,433 | -79,894 | -61,088 | 1,540 | -3,381 | -118,350 | -51,575 | 5,841 | 64,513 |
| 2007 | 180,513 | 174,506 | -51,677 | -47,626 | -114,779 | -78,825 | -45,808 | 39,714 | -77,570 | -92,975 | 26,406 | 134,776 |
| 2008 | 246,659 | 136,775 | 26,966 | -52,649 | -110,595 | -54,497 | -33,358 | -45,625 | -56,713 | -93,101 | -38,960 | 69,109 |
| 2009 | 149,452 | 43,796 | -35,673 | -92,316 | -119,979 | -63,524 | -67,937 | -30,901 | -70,329 | -30,352 | -32,682 | 212,376 |
| 2010 | 243,128 | 195,035 | -61,411 | -148,824 | -122,920 | -69,031 | -24,936 | 13,555 | -124,409 | -147,571 | -23,415 | 175,541 |
| 2011 | 222,561 | 156,099 | -37,992 | -90,939 | -124,632 | -40,170 | 11,729 | 15,350 | -104,598 | -156,857 | -31,764 | 68,833 |
| 2012 | 102,736 | 117,432 | -80,824 | -17,432 | -48,479 | -34,198 | 2,783 | -1,009 | -80,985 | -78,892 | 6,729 | 90,373 |
| 2013 | 184,547 | 174,804 | 113,433 | -51,584 | -135,031 | -89,218 | -70,653 | -34,823 | -93,486 | -91,928 | 55,167 | 183,183 |
| 2014 | 332,106 | 222,538 | 117,453 | -90,530 | -135,655 | -112,093 | -91,370 | -54,243 | -124,698 | -164,507 | 6,452 | 40,466 |
| - = No Data Reported; -- = Not Applicable; NA = Not Available; W = Withheld to avoid disclosure of individual company data. |
| Release Date: 8/30/2024 |
| Next Release Date: 9/30/2024 |