|
Download Data (XLS File) |
|
||||||||
|
||||||||
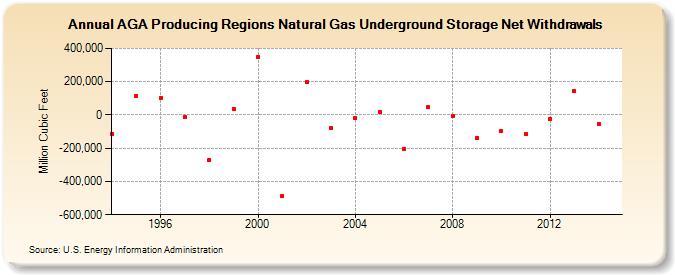
| AGA Producing Regions Natural Gas Underground Storage Net Withdrawals (Million Cubic Feet) | ||||||||
| Decade | Year-0 | Year-1 | Year-2 | Year-3 | Year-4 | Year-5 | Year-6 | Year-7 | Year-8 | Year-9 |
|---|---|---|---|---|---|---|---|---|---|---|
| 1990's | -114,419 | 113,822 | 102,555 | -13,990 | -270,114 | 36,826 | ||||
| 2000's | 350,177 | -489,871 | 196,415 | -81,500 | -18,748 | 18,569 | -203,400 | 46,656 | -5,990 | -138,071 |
| 2010's | -95,259 | -112,380 | -21,766 | 144,411 | -54,080 |
| - = No Data Reported; -- = Not Applicable; NA = Not Available; W = Withheld to avoid disclosure of individual company data. |
| Release Date: 3/29/2024 |
| Next Release Date: 4/30/2024 |