|
Download Data (XLS File) |
|
||||||||
|
||||||||
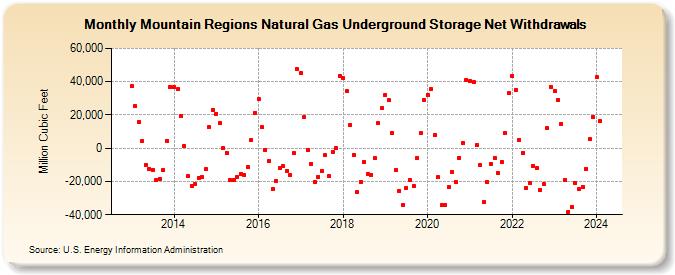
| Mountain Regions Natural Gas Underground Storage Net Withdrawals (Million Cubic Feet) | ||||||||
| Year | Jan | Feb | Mar | Apr | May | Jun | Jul | Aug | Sep | Oct | Nov | Dec |
|---|---|---|---|---|---|---|---|---|---|---|---|---|
| 2013 | 37,184 | 25,215 | 15,667 | 4,235 | -9,878 | -12,364 | -12,947 | -19,099 | -18,354 | -13,092 | 4,474 | 36,919 |
| 2014 | 36,887 | 35,320 | 19,358 | 1,434 | -16,967 | -22,706 | -21,457 | -17,858 | -17,611 | -12,768 | 12,630 | 22,941 |
| 2015 | 20,797 | 15,081 | 34 | -2,853 | -19,103 | -19,419 | -17,214 | -15,317 | -16,112 | -11,462 | 5,213 | 21,235 |
| 2016 | 29,411 | 12,562 | -910 | -7,610 | -24,646 | -19,694 | -12,088 | -10,773 | -13,469 | -16,117 | -3,096 | 47,355 |
| 2017 | 45,258 | 18,701 | -1,014 | -9,318 | -20,183 | -17,044 | -13,527 | -4,273 | -16,801 | -2,273 | -48 | 43,405 |
| 2018 | 42,077 | 34,295 | 13,898 | -4,022 | -26,486 | -20,081 | -8,038 | -15,390 | -15,884 | -5,921 | 14,985 | 24,109 |
| 2019 | 32,052 | 28,709 | 9,168 | -13,181 | -25,528 | -34,133 | -23,655 | -19,137 | -22,565 | -5,794 | 8,933 | 29,099 |
| 2020 | 32,202 | 35,684 | 7,843 | -17,569 | -34,268 | -34,276 | -23,461 | -14,562 | -20,140 | -5,697 | 3,184 | 41,229 |
| 2021 | 40,256 | 39,736 | 1,826 | -10,332 | -32,393 | -20,384 | -9,503 | -5,867 | -14,863 | -8,100 | 9,041 | 33,005 |
| 2022 | 43,465 | 35,088 | 4,961 | -2,899 | -23,929 | -20,661 | -10,460 | -11,910 | -25,034 | -21,620 | 11,935 | 36,940 |
| 2023 | 34,562 | 29,135 | 14,602 | -18,960 | -38,303 | -35,233 | -20,717 | -24,424 | -23,056 | -12,360 | 5,330 | 19,006 |
| 2024 | 42,511 | 16,274 | ||||||||||
| - = No Data Reported; -- = Not Applicable; NA = Not Available; W = Withheld to avoid disclosure of individual company data. |
| Release Date: 4/30/2024 |
| Next Release Date: 5/31/2024 |