|
Download Data (XLS File) |
|
||||||||
|
||||||||
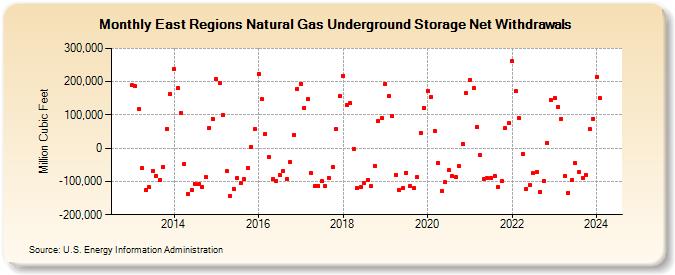
| East Regions Natural Gas Underground Storage Net Withdrawals (Million Cubic Feet) | ||||||||
| Year | Jan | Feb | Mar | Apr | May | Jun | Jul | Aug | Sep | Oct | Nov | Dec |
|---|---|---|---|---|---|---|---|---|---|---|---|---|
| 2013 | 188,486 | 185,751 | 116,370 | -58,916 | -126,099 | -117,864 | -68,088 | -82,141 | -94,214 | -55,796 | 58,838 | 162,468 |
| 2014 | 237,678 | 179,804 | 106,232 | -46,858 | -136,399 | -125,529 | -106,553 | -108,445 | -116,239 | -86,683 | 61,045 | 89,203 |
| 2015 | 207,094 | 195,328 | 98,805 | -69,546 | -143,415 | -121,926 | -90,699 | -104,740 | -93,873 | -59,024 | 4,664 | 57,349 |
| 2016 | 224,367 | 147,134 | 43,370 | -26,242 | -94,019 | -98,011 | -80,704 | -69,715 | -93,871 | -41,275 | 41,017 | 178,429 |
| 2017 | 193,754 | 121,986 | 147,438 | -75,713 | -114,589 | -114,416 | -100,093 | -115,156 | -88,761 | -57,810 | 57,175 | 156,637 |
| 2018 | 217,855 | 130,329 | 135,016 | -1,702 | -119,003 | -117,095 | -104,413 | -94,340 | -114,671 | -52,163 | 80,420 | 90,655 |
| 2019 | 192,196 | 156,555 | 96,588 | -79,702 | -124,445 | -119,128 | -73,729 | -113,942 | -121,067 | -86,802 | 46,186 | 121,922 |
| 2020 | 172,146 | 154,758 | 53,092 | -44,042 | -127,585 | -102,618 | -66,726 | -83,729 | -88,058 | -54,334 | 13,968 | 164,912 |
| 2021 | 206,207 | 180,475 | 65,032 | -21,718 | -92,321 | -89,698 | -90,233 | -83,313 | -116,390 | -100,064 | 61,551 | 75,271 |
| 2022 | 261,794 | 171,828 | 90,161 | -17,426 | -123,191 | -111,281 | -75,389 | -72,349 | -130,468 | -98,691 | 16,769 | 143,891 |
| 2023 | 150,761 | 124,708 | 89,152 | -84,458 | -133,447 | -95,962 | -45,335 | -72,778 | -88,140 | -79,272 | 56,369 | 89,220 |
| 2024 | 215,285 | 149,405 | ||||||||||
| - = No Data Reported; -- = Not Applicable; NA = Not Available; W = Withheld to avoid disclosure of individual company data. |
| Release Date: 4/30/2024 |
| Next Release Date: 5/31/2024 |