|
Download Data (XLS File) |
|
||||||||
|
||||||||
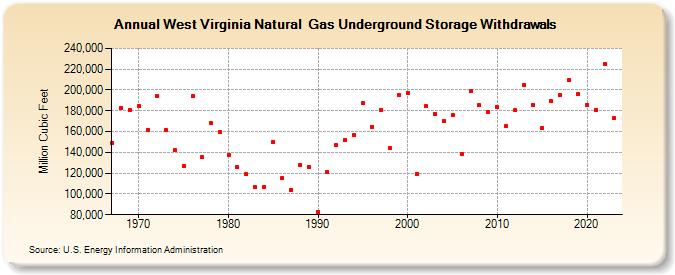
| West Virginia Natural Gas Underground Storage Withdrawals (Million Cubic Feet) | ||||||||
| Decade | Year-0 | Year-1 | Year-2 | Year-3 | Year-4 | Year-5 | Year-6 | Year-7 | Year-8 | Year-9 |
|---|---|---|---|---|---|---|---|---|---|---|
| 1960's | 149,030 | 182,982 | 181,142 | |||||||
| 1970's | 184,862 | 161,539 | 194,109 | 161,474 | 141,995 | 126,860 | 194,046 | 135,134 | 168,337 | 159,319 |
| 1980's | 137,474 | 125,753 | 119,103 | 106,200 | 106,758 | 149,952 | 114,872 | 104,225 | 127,909 | 125,796 |
| 1990's | 82,558 | 121,139 | 146,827 | 151,836 | 156,284 | 187,088 | 164,768 | 181,015 | 143,924 | 194,788 |
| 2000's | 197,530 | 119,498 | 184,205 | 176,980 | 170,127 | 176,117 | 138,602 | 198,707 | 185,481 | 178,365 |
| 2010's | 183,311 | 164,898 | 180,437 | 204,949 | 185,367 | 163,568 | 189,088 | 194,966 | 209,731 | 195,855 |
| 2020's | 185,693 | 181,165 | 225,289 | 172,838 |
| - = No Data Reported; -- = Not Applicable; NA = Not Available; W = Withheld to avoid disclosure of individual company data. |
| Release Date: 3/29/2024 |
| Next Release Date: 4/30/2024 |