|
Download Data (XLS File) |
|
||||||||
|
||||||||
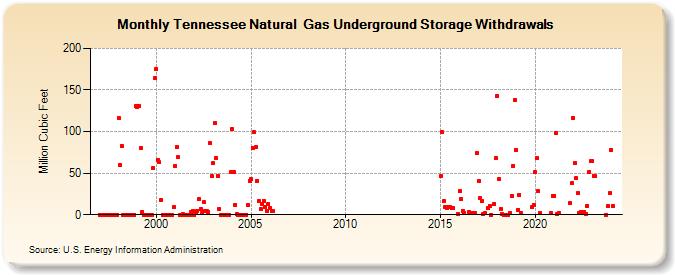
| Tennessee Natural Gas Underground Storage Withdrawals (Million Cubic Feet) | ||||||||
| Year | Jan | Feb | Mar | Apr | May | Jun | Jul | Aug | Sep | Oct | Nov | Dec |
|---|---|---|---|---|---|---|---|---|---|---|---|---|
| 1997 | 0 | 0 | 0 | 0 | 0 | 0 | 0 | 0 | 0 | 0 | 0 | 0 |
| 1998 | 116 | 60 | 83 | 0 | 0 | 0 | 0 | 0 | 0 | 0 | 0 | 131 |
| 1999 | 130 | 131 | 80 | 3 | 0 | 0 | 0 | 0 | 0 | 0 | 56 | 164 |
| 2000 | 175 | 66 | 63 | 18 | 0 | 0 | 0 | 0 | 0 | 0 | 0 | 9 |
| 2001 | 59 | 82 | 69 | 0 | 0 | 1 | 0 | 0 | 0 | 0 | 3 | 5 |
| 2002 | 0 | 2 | 5 | 19 | 7 | 2 | 15 | 5 | 4 | 3 | 86 | 46 |
| 2003 | 62 | 110 | 68 | 47 | 7 | 0 | 0 | 0 | 0 | 0 | 0 | 51 |
| 2004 | 103 | 51 | 12 | 1 | 0 | 0 | 0 | 0 | 0 | 0 | 12 | 41 |
| 2005 | 43 | 80 | 99 | 81 | 41 | 17 | 7 | 13 | 17 | 9 | 5 | 13 |
| 2006 | 8 | 4 | 4 | |||||||||
| 2015 | 46 | 99 | 16 | 9 | 8 | 9 | 9 | 8 | 8 | 1 | ||
| 2016 | 28 | 19 | 5 | 2 | 3 | 2 | 2 | 2 | 2 | 74 | ||
| 2017 | 40 | 20 | 16 | 1 | 2 | 8 | 11 | 0 | 13 | 68 | ||
| 2018 | 143 | 43 | 7 | 1 | 0 | 0 | 0 | 0 | 2 | 23 | 59 | 138 |
| 2019 | 78 | 6 | 24 | 2 | 9 | 12 | ||||||
| 2020 | 51 | 68 | 28 | 2 | 2 | 23 | ||||||
| 2021 | 23 | 98 | 1 | 2 | 14 | 38 | ||||||
| 2022 | 116 | 62 | 44 | 26 | 2 | 3 | 3 | 3 | 1 | 11 | 51 | 64 |
| 2023 | 64 | 47 | 46 | 0 | 10 | 26 | ||||||
| 2024 | 78 | |||||||||||
| - = No Data Reported; -- = Not Applicable; NA = Not Available; W = Withheld to avoid disclosure of individual company data. |
| Release Date: 3/29/2024 |
| Next Release Date: 4/30/2024 |