|
Download Data (XLS File) |
|
||||||||
|
||||||||
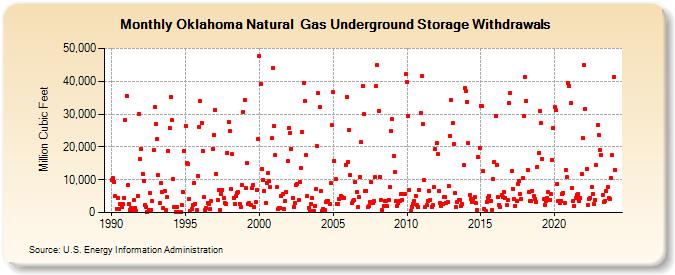
| Oklahoma Natural Gas Underground Storage Withdrawals (Million Cubic Feet) | ||||||||
| Year | Jan | Feb | Mar | Apr | May | Jun | Jul | Aug | Sep | Oct | Nov | Dec |
|---|---|---|---|---|---|---|---|---|---|---|---|---|
| 1990 | 9,892 | 10,432 | 9,330 | 4,987 | 1,208 | 4,579 | 1,073 | 2,680 | 1,559 | 2,651 | 4,367 | 28,218 |
| 1991 | 35,573 | 8,331 | 2,684 | 900 | 1,274 | 409 | 3,721 | 1,515 | 500 | 5,004 | 30,092 | 16,355 |
| 1992 | 19,223 | 11,792 | 9,718 | 2,349 | 1,822 | 267 | 760 | 5,882 | 918 | 3,471 | 19,148 | 32,175 |
| 1993 | 26,929 | 22,493 | 11,333 | 2,936 | 8,991 | 6,234 | 1,306 | 6,419 | 655 | 4,731 | 18,793 | 25,894 |
| 1994 | 35,071 | 28,105 | 10,274 | 1,845 | 231 | 1,699 | 126 | 148 | 133 | 2,153 | 6,156 | 18,797 |
| 1995 | 26,454 | 15,201 | 14,894 | 4,278 | 359 | 1,007 | 2,158 | 9,079 | 2,724 | 684 | 11,077 | 26,158 |
| 1996 | 34,101 | 27,284 | 18,722 | 4,616 | 653 | 1,455 | 2,980 | 2,709 | 1,033 | 3,458 | 19,317 | 23,700 |
| 1997 | 31,372 | 11,891 | 3,726 | 6,834 | 715 | 5,752 | 6,900 | 4,332 | 2,986 | 2,730 | 18,200 | 27,570 |
| 1998 | 24,906 | 7,100 | 17,706 | 4,512 | 2,632 | 4,949 | 6,030 | 6,221 | 2,610 | 1,755 | 8,490 | 30,713 |
| 1999 | 34,391 | 7,341 | 15,111 | 2,708 | 2,771 | 2,240 | 7,551 | 8,358 | 1,719 | 3,128 | 6,960 | 22,332 |
| 2000 | 47,747 | 39,093 | 13,407 | 9,883 | 6,630 | 2,960 | 9,059 | 11,947 | 9,514 | 7,749 | 22,580 | 44,072 |
| 2001 | 26,289 | 17,447 | 7,703 | 986 | 1,319 | 1,414 | 4,913 | 5,581 | 1,190 | 3,445 | 6,384 | 15,573 |
| 2002 | 25,817 | 24,368 | 19,361 | 4,492 | 1,672 | 2,760 | 8,464 | 8,738 | 3,820 | 9,227 | 13,437 | 24,685 |
| 2003 | 39,499 | 33,901 | 17,528 | 5,094 | 1,436 | 557 | 2,692 | 4,524 | 525 | 1,994 | 7,167 | 20,133 |
| 2004 | 36,313 | 32,131 | 6,565 | 403 | 1,073 | 745 | 3,151 | 3,611 | 3,555 | 2,629 | 9,041 | 26,522 |
| 2005 | 36,586 | 15,823 | 10,102 | 2,698 | 2,531 | 4,124 | 5,066 | 4,669 | 4,293 | 4,306 | 14,553 | 35,326 |
| 2006 | 15,451 | 25,083 | 11,328 | 2,825 | 3,481 | 3,704 | 9,192 | 6,233 | 1,694 | 4,626 | 10,864 | 21,340 |
| 2007 | 38,510 | 29,894 | 6,482 | 6,652 | 1,597 | 1,848 | 3,284 | 9,193 | 2,882 | 3,554 | 10,699 | 38,553 |
| 2008 | 45,078 | 31,064 | 10,818 | 3,955 | 837 | 2,123 | 3,410 | 3,519 | 1,896 | 3,929 | 7,862 | 24,717 |
| 2009 | 28,384 | 17,359 | 12,484 | 3,447 | 1,926 | 2,777 | 3,578 | 5,591 | 3,796 | 5,638 | 5,514 | 42,180 |
| 2010 | 39,758 | 29,276 | 7,009 | 579 | 1,752 | 2,556 | 3,446 | 5,134 | 2,238 | 1,549 | 6,857 | 30,316 |
| 2011 | 41,441 | 26,910 | 9,783 | 1,789 | 2,273 | 3,450 | 6,579 | 3,852 | 1,829 | 2,163 | 7,769 | 19,321 |
| 2012 | 21,066 | 17,746 | 6,421 | 2,786 | 2,149 | 2,713 | 4,683 | 4,672 | 3,046 | 3,191 | 8,179 | 23,449 |
| 2013 | 34,412 | 27,276 | 20,729 | 5,942 | 1,603 | 3,321 | 3,860 | 3,863 | 2,092 | 2,605 | 14,442 | 37,863 |
| 2014 | 36,889 | 33,752 | 21,059 | 5,282 | 4,134 | 3,219 | 4,172 | 4,595 | 3,004 | 734 | 16,878 | 19,702 |
| 2015 | 32,507 | 32,362 | 12,546 | 1,207 | 588 | 3,262 | 4,541 | 4,992 | 3,420 | 914 | 10,310 | 15,323 |
| 2016 | 29,426 | 14,589 | 4,683 | 2,294 | 1,711 | 5,214 | 4,845 | 6,326 | 4,493 | 2,208 | 3,856 | 33,505 |
| 2017 | 36,351 | 12,655 | 7,317 | 3,988 | 2,135 | 3,445 | 8,748 | 9,478 | 5,718 | 4,155 | 10,375 | 29,325 |
| 2018 | 41,384 | 33,914 | 13,112 | 6,237 | 3,436 | 3,566 | 6,672 | 4,935 | 4,188 | 3,266 | 14,006 | 18,268 |
| 2019 | 30,827 | 27,291 | 16,450 | 4,045 | 2,229 | 3,672 | 4,424 | 6,112 | 3,842 | 5,628 | 15,951 | 25,863 |
| 2020 | 32,250 | 31,155 | 8,821 | 3,554 | 3,055 | 3,665 | 5,680 | 6,051 | 3,037 | 13,009 | 10,716 | 39,434 |
| 2021 | 38,518 | 33,325 | 7,352 | 3,415 | 2,097 | 4,364 | 5,325 | 5,694 | 3,666 | 4,342 | 11,681 | 22,707 |
| 2022 | 44,943 | 31,489 | 13,236 | 2,420 | 4,211 | 4,537 | 7,746 | 5,787 | 2,580 | 3,906 | 14,377 | 26,653 |
| 2023 | 23,504 | 19,162 | 17,546 | 5,318 | 3,138 | 3,610 | 6,428 | 7,917 | 4,394 | 4,174 | 10,502 | 17,387 |
| 2024 | 41,211 | |||||||||||
| - = No Data Reported; -- = Not Applicable; NA = Not Available; W = Withheld to avoid disclosure of individual company data. |
| Release Date: 3/29/2024 |
| Next Release Date: 4/30/2024 |