|
Download Data (XLS File) |
|
||||||||
|
||||||||
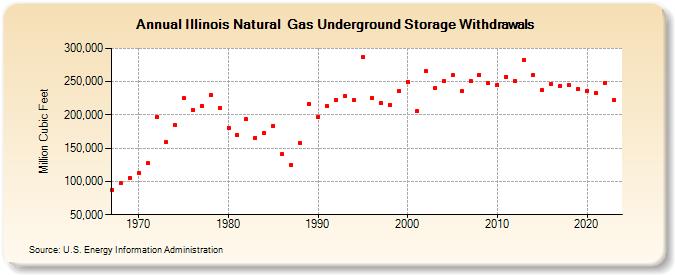
| Illinois Natural Gas Underground Storage Withdrawals (Million Cubic Feet) | ||||||||
| Decade | Year-0 | Year-1 | Year-2 | Year-3 | Year-4 | Year-5 | Year-6 | Year-7 | Year-8 | Year-9 |
|---|---|---|---|---|---|---|---|---|---|---|
| 1960's | 87,630 | 97,146 | 105,337 | |||||||
| 1970's | 112,468 | 127,279 | 197,188 | 158,590 | 184,540 | 225,383 | 207,921 | 213,842 | 230,526 | 209,924 |
| 1980's | 180,764 | 169,502 | 193,480 | 165,746 | 173,305 | 183,650 | 140,510 | 124,889 | 157,954 | 216,543 |
| 1990's | 197,150 | 213,210 | 223,012 | 228,319 | 222,871 | 286,390 | 226,020 | 217,632 | 215,309 | 235,609 |
| 2000's | 249,688 | 205,509 | 265,603 | 240,329 | 251,349 | 259,288 | 235,590 | 251,122 | 259,827 | 247,957 |
| 2010's | 245,135 | 257,504 | 250,955 | 282,499 | 260,100 | 237,236 | 246,869 | 243,975 | 244,708 | 239,138 |
| 2020's | 236,053 | 232,691 | 248,455 | 222,509 |
| - = No Data Reported; -- = Not Applicable; NA = Not Available; W = Withheld to avoid disclosure of individual company data. |
| Release Date: 3/29/2024 |
| Next Release Date: 4/30/2024 |