|
Download Data (XLS File) |
|
||||||||
|
||||||||
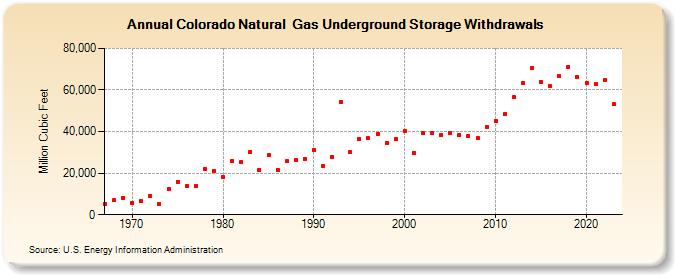
| Colorado Natural Gas Underground Storage Withdrawals (Million Cubic Feet) | ||||||||
| Decade | Year-0 | Year-1 | Year-2 | Year-3 | Year-4 | Year-5 | Year-6 | Year-7 | Year-8 | Year-9 |
|---|---|---|---|---|---|---|---|---|---|---|
| 1960's | 5,257 | 6,850 | 8,128 | |||||||
| 1970's | 5,630 | 6,433 | 9,024 | 5,383 | 12,354 | 15,885 | 13,855 | 13,820 | 21,925 | 21,193 |
| 1980's | 18,155 | 25,932 | 25,198 | 30,288 | 21,531 | 28,711 | 21,743 | 25,601 | 26,380 | 26,942 |
| 1990's | 31,174 | 23,214 | 27,921 | 54,294 | 30,085 | 36,565 | 36,804 | 38,864 | 34,717 | 36,325 |
| 2000's | 40,215 | 29,871 | 39,121 | 39,387 | 38,172 | 39,442 | 38,506 | 37,986 | 36,894 | 42,419 |
| 2010's | 45,010 | 48,341 | 56,525 | 63,531 | 70,692 | 64,053 | 61,678 | 66,532 | 71,288 | 66,101 |
| 2020's | 63,351 | 62,647 | 64,559 | 53,108 |
| - = No Data Reported; -- = Not Applicable; NA = Not Available; W = Withheld to avoid disclosure of individual company data. |
| Release Date: 3/29/2024 |
| Next Release Date: 4/30/2024 |