|
Download Data (XLS File) |
|
||||||||
|
||||||||
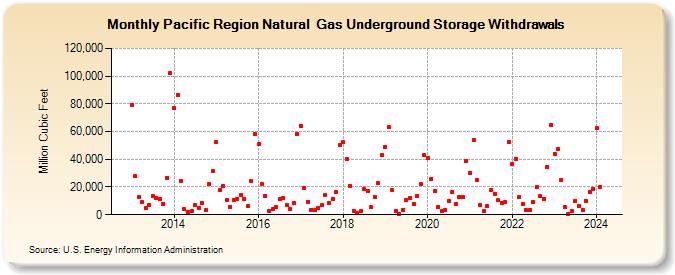
| Pacific Region Natural Gas Underground Storage Withdrawals (Million Cubic Feet) | ||||||||
| Year | Jan | Feb | Mar | Apr | May | Jun | Jul | Aug | Sep | Oct | Nov | Dec |
|---|---|---|---|---|---|---|---|---|---|---|---|---|
| 2013 | 79,247 | 27,640 | 12,636 | 8,836 | 4,974 | 7,165 | 13,208 | 12,369 | 11,163 | 7,969 | 26,601 | 101,973 |
| 2014 | 76,707 | 86,452 | 24,564 | 4,043 | 2,164 | 2,455 | 6,733 | 4,852 | 8,180 | 3,311 | 22,305 | 31,554 |
| 2015 | 52,490 | 18,060 | 20,604 | 10,898 | 5,699 | 10,860 | 11,475 | 13,959 | 11,378 | 6,402 | 24,246 | 57,876 |
| 2016 | 50,941 | 22,072 | 13,660 | 2,613 | 4,068 | 5,755 | 11,056 | 12,142 | 6,827 | 4,459 | 8,757 | 58,332 |
| 2017 | 64,051 | 19,066 | 9,062 | 3,741 | 3,272 | 5,193 | 6,758 | 14,032 | 8,552 | 11,587 | 16,573 | 50,043 |
| 2018 | 52,377 | 40,330 | 20,972 | 3,011 | 1,082 | 2,582 | 18,758 | 17,447 | 5,366 | 12,868 | 22,983 | 42,939 |
| 2019 | 49,053 | 63,227 | 17,992 | 2,743 | 724 | 3,462 | 10,756 | 11,948 | 8,075 | 13,576 | 21,804 | 42,988 |
| 2020 | 40,681 | 25,750 | 17,465 | 5,655 | 2,513 | 3,259 | 9,914 | 16,441 | 7,649 | 12,992 | 13,111 | 38,685 |
| 2021 | 30,385 | 53,754 | 25,343 | 6,846 | 2,381 | 6,090 | 17,696 | 15,262 | 10,323 | 8,664 | 9,226 | 52,794 |
| 2022 | 36,334 | 40,409 | 12,467 | 7,811 | 3,062 | 3,690 | 9,023 | 20,127 | 13,163 | 11,582 | 34,492 | 64,511 |
| 2023 | 44,004 | 47,406 | 25,204 | 5,262 | 780 | 2,528 | 10,214 | 6,112 | 3,186 | 10,117 | 16,310 | 18,730 |
| 2024 | 62,288 | |||||||||||
| - = No Data Reported; -- = Not Applicable; NA = Not Available; W = Withheld to avoid disclosure of individual company data. |
| Release Date: 3/29/2024 |
| Next Release Date: 4/30/2024 |