|
Download Data (XLS File) |
|
||||||||
|
||||||||
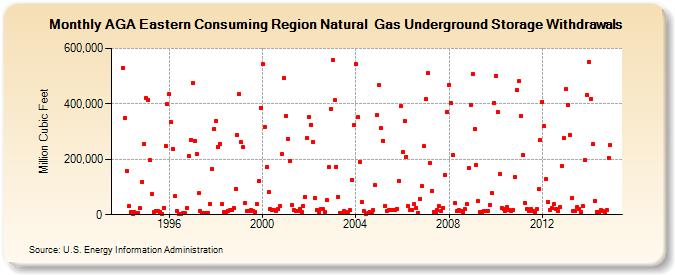
| AGA Eastern Consuming Region Natural Gas Underground Storage Withdrawals (Million Cubic Feet) | ||||||||
| Year | Jan | Feb | Mar | Apr | May | Jun | Jul | Aug | Sep | Oct | Nov | Dec |
|---|---|---|---|---|---|---|---|---|---|---|---|---|
| 1994 | 530,741 | 349,007 | 159,102 | 30,353 | 9,093 | 4,218 | 8,493 | 5,462 | 6,537 | 22,750 | 119,120 | 256,340 |
| 1995 | 419,951 | 414,116 | 196,271 | 76,470 | 8,845 | 14,449 | 13,084 | 9,496 | 3,715 | 25,875 | 247,765 | 398,851 |
| 1996 | 435,980 | 333,314 | 236,872 | 66,149 | 12,958 | 4,261 | 2,804 | 5,141 | 5,152 | 24,515 | 213,277 | 269,811 |
| 1997 | 474,777 | 267,717 | 218,640 | 76,956 | 11,974 | 4,401 | 7,277 | 5,503 | 5,269 | 39,662 | 165,807 | 309,399 |
| 1998 | 339,858 | 244,813 | 256,560 | 37,278 | 8,764 | 11,317 | 14,830 | 15,207 | 16,026 | 23,854 | 94,110 | 287,801 |
| 1999 | 437,182 | 261,305 | 244,041 | 43,642 | 13,904 | 11,738 | 17,499 | 14,984 | 9,984 | 37,822 | 122,731 | 385,958 |
| 2000 | 542,350 | 316,056 | 173,580 | 80,347 | 19,215 | 17,895 | 16,139 | 13,917 | 19,392 | 32,136 | 218,106 | 493,755 |
| 2001 | 357,013 | 274,074 | 193,075 | 33,794 | 17,074 | 11,691 | 11,712 | 19,909 | 10,588 | 32,337 | 65,304 | 277,266 |
| 2002 | 351,042 | 325,028 | 263,887 | 61,605 | 18,126 | 9,229 | 21,636 | 19,377 | 10,279 | 51,819 | 171,271 | 382,245 |
| 2003 | 559,536 | 412,523 | 172,950 | 64,378 | 6,737 | 5,282 | 13,130 | 11,472 | 5,282 | 16,510 | 125,658 | 323,326 |
| 2004 | 542,456 | 350,990 | 191,732 | 46,765 | 12,895 | 4,358 | 5,957 | 11,595 | 10,525 | 16,817 | 105,892 | 359,092 |
| 2005 | 466,622 | 311,819 | 267,032 | 33,179 | 15,086 | 16,891 | 18,690 | 18,808 | 15,606 | 22,108 | 120,339 | 391,034 |
| 2006 | 224,445 | 338,370 | 209,360 | 32,028 | 17,886 | 18,640 | 38,457 | 25,012 | 7,572 | 57,731 | 103,046 | 247,326 |
| 2007 | 418,087 | 510,537 | 188,102 | 85,207 | 10,624 | 9,014 | 16,199 | 30,318 | 14,939 | 24,072 | 143,286 | 370,167 |
| 2008 | 469,010 | 403,600 | 214,860 | 43,051 | 12,412 | 15,693 | 14,141 | 9,270 | 20,579 | 36,851 | 170,214 | 396,277 |
| 2009 | 508,498 | 308,705 | 180,133 | 48,134 | 9,321 | 10,339 | 13,796 | 14,688 | 13,856 | 35,234 | 76,744 | 403,097 |
| 2010 | 501,739 | 372,121 | 148,408 | 25,218 | 19,301 | 14,836 | 26,500 | 18,317 | 13,337 | 17,769 | 134,906 | 449,737 |
| 2011 | 481,140 | 354,956 | 214,663 | 44,018 | 19,181 | 13,642 | 20,214 | 12,353 | 9,217 | 19,395 | 93,577 | 269,663 |
| 2012 | 407,524 | 318,425 | 129,237 | 47,099 | 18,469 | 22,574 | 37,102 | 22,059 | 12,751 | 26,245 | 176,818 | 275,798 |
| 2013 | 454,168 | 396,228 | 287,074 | 60,223 | 12,282 | 12,440 | 26,604 | 21,450 | 10,694 | 30,032 | 195,959 | 431,187 |
| 2014 | 552,582 | 418,573 | 254,547 | 50,501 | 11,091 | 8,907 | 16,841 | 13,273 | 7,987 | 16,424 | 205,766 | 250,711 |
| - = No Data Reported; -- = Not Applicable; NA = Not Available; W = Withheld to avoid disclosure of individual company data. |
| Release Date: 3/29/2024 |
| Next Release Date: 4/30/2024 |