|
Download Data (XLS File) |
|
||||||||
|
||||||||
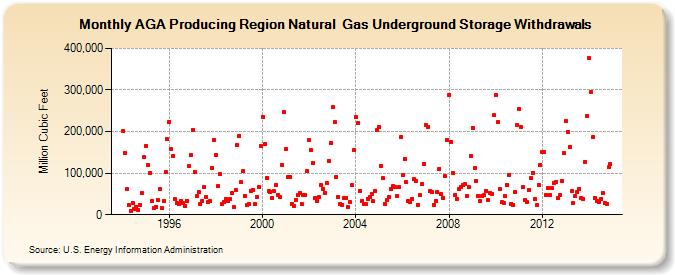
| AGA Producing Region Natural Gas Underground Storage Withdrawals (Million Cubic Feet) | ||||||||
| Year | Jan | Feb | Mar | Apr | May | Jun | Jul | Aug | Sep | Oct | Nov | Dec |
|---|---|---|---|---|---|---|---|---|---|---|---|---|
| 1994 | 201,567 | 147,250 | 61,339 | 23,149 | 9,789 | 29,178 | 13,371 | 19,352 | 10,151 | 24,102 | 52,809 | 137,962 |
| 1995 | 166,242 | 120,089 | 100,955 | 31,916 | 17,279 | 19,712 | 35,082 | 62,364 | 16,966 | 33,762 | 102,735 | 181,097 |
| 1996 | 223,932 | 157,642 | 141,292 | 36,788 | 27,665 | 26,393 | 32,861 | 27,599 | 20,226 | 34,000 | 116,431 | 142,519 |
| 1997 | 204,601 | 103,715 | 43,894 | 54,285 | 24,898 | 34,122 | 65,631 | 42,757 | 30,579 | 32,257 | 113,422 | 180,582 |
| 1998 | 143,042 | 69,667 | 97,322 | 25,555 | 30,394 | 38,537 | 33,314 | 37,034 | 51,903 | 17,812 | 60,078 | 168,445 |
| 1999 | 189,816 | 77,848 | 104,690 | 44,930 | 22,829 | 26,085 | 58,109 | 60,549 | 25,888 | 43,790 | 66,980 | 165,046 |
| 2000 | 235,243 | 171,116 | 88,727 | 56,077 | 55,603 | 39,367 | 56,318 | 70,953 | 47,560 | 42,721 | 119,567 | 246,169 |
| 2001 | 157,526 | 89,704 | 90,677 | 26,776 | 20,137 | 34,819 | 48,232 | 52,741 | 26,160 | 48,333 | 48,539 | 104,376 |
| 2002 | 178,604 | 154,836 | 125,331 | 40,774 | 32,835 | 41,422 | 70,403 | 61,898 | 52,473 | 76,943 | 130,147 | 172,914 |
| 2003 | 258,386 | 221,879 | 91,394 | 42,042 | 26,254 | 24,286 | 41,253 | 41,131 | 17,710 | 30,518 | 71,261 | 156,218 |
| 2004 | 234,853 | 220,509 | 57,165 | 33,634 | 25,699 | 26,259 | 38,656 | 42,236 | 50,679 | 32,077 | 57,619 | 204,564 |
| 2005 | 210,752 | 116,768 | 87,656 | 25,253 | 35,190 | 42,190 | 62,799 | 68,056 | 66,585 | 44,910 | 66,409 | 186,845 |
| 2006 | 95,076 | 134,268 | 77,583 | 33,271 | 30,190 | 38,750 | 84,757 | 80,005 | 24,201 | 46,473 | 73,725 | 122,060 |
| 2007 | 215,434 | 212,073 | 56,034 | 54,671 | 24,125 | 33,375 | 54,536 | 111,067 | 48,631 | 40,918 | 91,919 | 179,953 |
| 2008 | 288,514 | 175,194 | 100,226 | 47,123 | 37,371 | 60,708 | 67,517 | 72,526 | 72,894 | 44,851 | 65,959 | 141,053 |
| 2009 | 209,188 | 111,478 | 81,782 | 44,995 | 31,828 | 45,450 | 46,781 | 57,090 | 34,430 | 52,570 | 50,338 | 238,685 |
| 2010 | 287,384 | 222,544 | 61,185 | 29,592 | 28,890 | 44,352 | 71,267 | 96,168 | 26,748 | 23,393 | 53,474 | 214,685 |
| 2011 | 253,245 | 211,692 | 67,504 | 34,931 | 30,831 | 60,491 | 87,831 | 100,098 | 37,690 | 22,385 | 72,104 | 120,198 |
| 2012 | 149,677 | 150,362 | 48,012 | 64,580 | 47,648 | 63,212 | 76,128 | 78,650 | 39,911 | 46,962 | 81,107 | 147,281 |
| 2013 | 225,633 | 199,952 | 163,024 | 56,240 | 28,542 | 45,341 | 55,267 | 62,806 | 40,050 | 37,965 | 127,423 | 236,578 |
| 2014 | 375,998 | 294,952 | 186,173 | 40,592 | 33,087 | 29,767 | 36,881 | 52,141 | 28,864 | 26,736 | 113,734 | 121,457 |
| - = No Data Reported; -- = Not Applicable; NA = Not Available; W = Withheld to avoid disclosure of individual company data. |
| Release Date: 3/29/2024 |
| Next Release Date: 4/30/2024 |