|
Download Data (XLS File) |
|
||||||||
|
||||||||
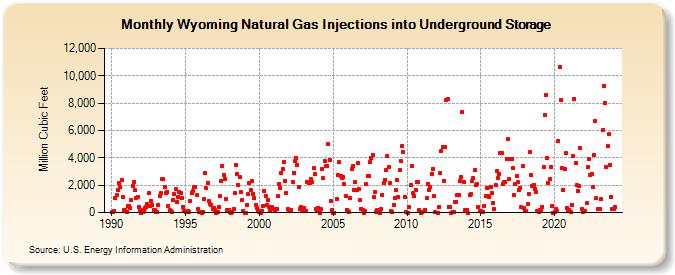
| Wyoming Natural Gas Injections into Underground Storage (Million Cubic Feet) | ||||||||
| Year | Jan | Feb | Mar | Apr | May | Jun | Jul | Aug | Sep | Oct | Nov | Dec |
|---|---|---|---|---|---|---|---|---|---|---|---|---|
| 1990 | 22 | 16 | 140 | 1,047 | 1,248 | 1,648 | 2,162 | 1,899 | 2,415 | 1,135 | 222 | 191 |
| 1991 | 56 | 467 | 479 | 368 | 908 | 1,922 | 2,233 | 1,628 | 1,090 | 1,135 | 423 | 164 |
| 1992 | 0 | 73 | 211 | 356 | 439 | 605 | 1,402 | 465 | 861 | 525 | 208 | 194 |
| 1993 | 8 | 15 | 557 | 1,247 | 1,443 | 2,426 | 2,423 | 1,875 | 1,433 | 1,533 | 482 | 163 |
| 1994 | 145 | 16 | 930 | 1,339 | 1,692 | 771 | 1,125 | 1,524 | 1,444 | 1,060 | 412 | 138 |
| 1995 | 17 | 76 | 89 | 67 | 863 | 1,452 | 1,588 | 1,896 | 1,849 | 1,265 | 236 | 52 |
| 1996 | 13 | 0 | 66 | 974 | 2,862 | 1,764 | 2,169 | 836 | 641 | 540 | 243 | 312 |
| 1997 | 157 | 0 | 47 | 372 | 1,205 | 2,308 | 3,418 | 2,734 | 2,461 | 986 | 222 | 170 |
| 1998 | 23 | 0 | 8 | 265 | 1,430 | 3,462 | 2,814 | 2,015 | 2,621 | 1,499 | 926 | 150 |
| 1999 | 0 | 0 | 573 | 1,322 | 2,151 | 1,668 | 2,300 | 1,377 | 1,064 | 519 | 360 | 124 |
| 2000 | 8 | 0 | 118 | 508 | 1,600 | 1,179 | 564 | 915 | 438 | 112 | 423 | 278 |
| 2001 | 283 | 103 | 254 | 1,188 | 2,085 | 1,818 | 2,905 | 3,175 | 3,723 | 2,321 | 1,418 | 235 |
| 2002 | 138 | 119 | 201 | 2,266 | 2,916 | 3,755 | 3,974 | 3,483 | 1,858 | 292 | 438 | 108 |
| 2003 | 337 | 101 | 100 | 2,245 | 2,187 | 2,170 | 2,460 | 2,240 | 3,227 | 2,816 | 283 | 137 |
| 2004 | 344 | 0 | 251 | 3,156 | 2,497 | 3,780 | 3,388 | 3,407 | 4,986 | 3,865 | 847 | 168 |
| 2005 | 0 | 0 | 998 | 2,763 | 3,672 | 2,646 | 2,503 | 2,593 | 2,083 | 1,189 | 216 | |
| 2006 | 126 | 19 | 1,076 | 3,177 | 3,379 | 1,656 | 2,204 | 1,628 | 3,651 | 1,748 | 913 | 242 |
| 2007 | 210 | 0 | 80 | 2,071 | 2,687 | 2,666 | 3,661 | 3,981 | 4,205 | 1,101 | 1,500 | 51 |
| 2008 | 210 | 73 | 0 | 276 | 1,317 | 2,156 | 2,392 | 3,080 | 4,101 | 3,335 | 2,161 | 94 |
| 2009 | 6 | 589 | 1,074 | 1,643 | 2,370 | 1,155 | 3,100 | 3,773 | 4,874 | 4,399 | 1,156 | 44 |
| 2010 | 0 | 437 | 1,980 | 3,434 | 1,398 | 1,184 | 1,676 | 2,216 | 2,215 | 222 | 0 | |
| 2011 | 25 | 202 | 1,031 | 2,077 | 1,650 | 1,860 | 2,830 | 3,207 | 1,215 | 5 | ||
| 2012 | 0 | 440 | 2,867 | 4,499 | 4,787 | 2,328 | 4,815 | 8,248 | 8,293 | 419 | 410 | |
| 2013 | 3 | 27 | 67 | 777 | 777 | 1,250 | 1,271 | 2,281 | 2,613 | 7,382 | 2,264 | 157 |
| 2014 | 81 | 187 | 1 | 1,277 | 1,355 | 2,299 | 2,527 | 3,089 | 2,028 | 2,075 | 438 | 84 |
| 2015 | 100 | 61 | 469 | 1,229 | 1,765 | 1,245 | 1,121 | 1,871 | 1,431 | 716 | 227 | |
| 2016 | 1,988 | 3,024 | 2,558 | 2,851 | 4,367 | 4,340 | 2,107 | 2,262 | 2,266 | 3,924 | 5,344 | 2,469 |
| 2017 | 3,933 | 3,942 | 3,271 | 1,304 | 2,100 | 2,647 | 2,209 | 1,614 | 1,805 | 437 | 3,406 | 358 |
| 2018 | 145 | 84 | 661 | 1,363 | 4,397 | 2,752 | 1,925 | 2,049 | 1,746 | 1,522 | 93 | 46 |
| 2019 | 200 | 94 | 436 | 3,305 | 7,133 | 8,585 | 3,970 | 2,149 | 2,471 | 3,350 | 498 | 3 |
| 2020 | 20 | 278 | 122 | 5,203 | 10,671 | 8,228 | 3,276 | 1,674 | 3,176 | 4,336 | 352 | 84 |
| 2021 | 173 | 43 | 563 | 4,112 | 8,330 | 3,626 | 1,993 | 1,558 | 1,933 | 4,702 | 257 | 72 |
| 2022 | 109 | 93 | 678 | 3,321 | 3,921 | 2,725 | 2,846 | 1,878 | 4,180 | 6,664 | 1,032 | 265 |
| 2023 | 294 | 242 | 990 | 6,009 | 9,274 | 8,026 | 3,356 | 4,832 | 5,707 | 3,510 | 1,169 | 275 |
| 2024 | 243 | 439 | 3,930 | 6,223 | 7,361 | 5,102 | ||||||
| - = No Data Reported; -- = Not Applicable; NA = Not Available; W = Withheld to avoid disclosure of individual company data. |
| Release Date: 8/30/2024 |
| Next Release Date: 9/30/2024 |